
The Bitcoin daily chart shows signs of weakness as it has consolidated for the last 7 days. As investors remain confused on where Bitcoin is headed, the asset has shown recent short-term strength rising 2.32% in the last 24 hours.
Bitcoin is currently trading at $17,225. Let’s break it down.
Previous Analysis
Last week’s analysis introduced a new indicator (to these articles) of charting – the Elliott Wave. The indicator predicted a short-term uptrend before a heavy downward move that will leave the marker devastated. As has been stated severally in these analysis articles, rumors have it that the black swan event may be on Christmas week.
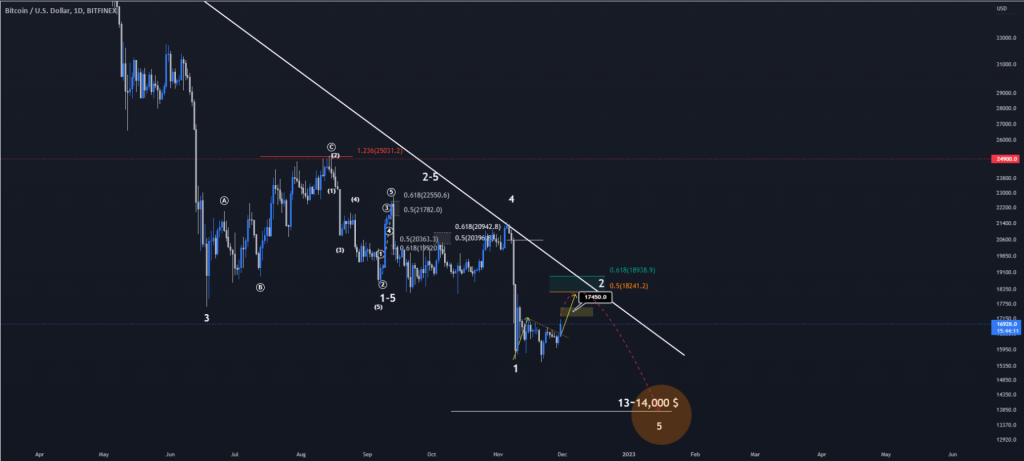
In the meantime, Bitcoin was expected to continue its short-term rise to around $18,500 before the crash came. At current prices, the asset is around $1,000 – $1,500 off from this target. Traders who are long should be weary.
Bitcoin Price Next Week
As we approach christmas week, the safest play is to remain in stable. But the trend will continue to be upward, possibly for the entirety of the coming week. That will be a +6.6% increase in the price of Bitcoin before the moment of truth arrives
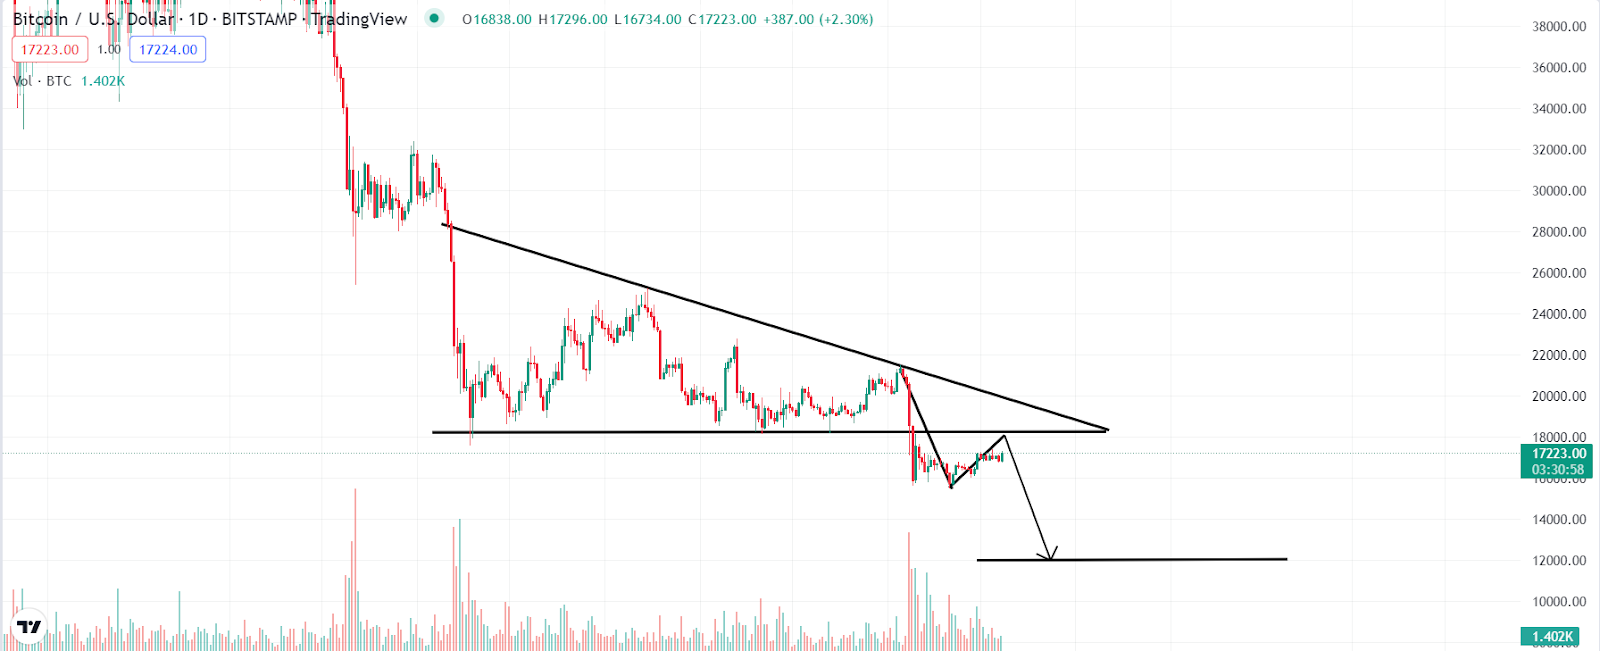
Bitcoin broke out of a descending triangle pattern – a bearish continuation pattern. Although descending triangles usually break to the upside most of the time, when they break down, the move is usually aggressive.
This Christmas is not going to be a fun one for anyone caught with their pants down.


