
Bitcoin (BTC) is on track for its most significant monthly loss in five months, having plunged 18%. While the asset is clearly down for the year, it has been showing signs of strength the past couple of weeks, especially the past two days. Perhaps this is an effect of FTX Ex-CEO, Sam Bankman-Fried’s interview where he said that FTX is actually solvent.
Whatever the case, Bitcoin is showing short term strength and setting up the mother of all bull traps for the bearish traders. Here’s the full analysis.
Previous Week Analysis

In last week’s analysis, BTC took a short-term retracement toward the 20-SMA, which would put BTC at around $17,400. If the price broke above the 20-day SMA on the upside, a possible bullish trend in the short term would be in play. The next potential resistance (the 50-day SMA), would be at $18,500.
However, until Bitcoin clears these areas and hills above the prolonged red resistance zone at the second lower high from the top. Traders should expect a crash at any time from that point. The next target for Bitcoin sits at around $17,700 to $18,950. We hoped that the following week might be turning green for Bitcoin.
Bitcoin Forecast
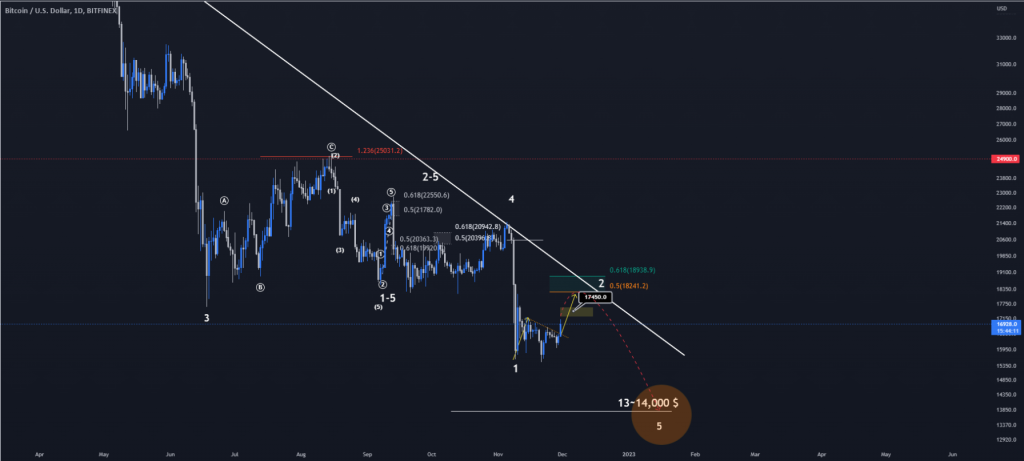
Bitcoin may continue the upward move to the 0.5 Fibonacci level which sits around $18,200 to $18,950. This level coincides with the 2-5 Cycle Wave trend line, which should move the price to close under these critical levels. This will necessitate the emergence of the 5th Wave Scenario (5) hence achieving the $13000- $14000 targets with ease.
This could be the last impulse move (5) in the Elliott Wave before Bitcoin reverses and becomes bullish. Therefore, traders should be cautious of being liquidated out of risky long positions.
Should any fundamentals break these Elliott Wave or Fibonacci Levels, our analysis will be rendered useless.
As of the time of writing, the Bitcoin price is $16,938.68. This is a change of -1.78% over the past 24 hours. So far this year, Bitcoin has a change of -62.98% with more red weeks coming up. Prices are still expected to crash to cover the last bearish leg before the bull market begins.
DISCLAIMER: The work included in this article is based on current events, technical charts, company news releases, and the author’s opinions. It may contain errors, and you shouldn’t make any investment decision based solely on what you read here.


