The article provides a technical analysis of the cryptocurrency AVAX, discussing key support areas, the daily RSI, the weekly chart, and price prediction for the token to help traders make informed investment decisions.
Avalanche (AVAX) is a cryptocurrency that has been gaining a lot of attention in the market recently due to its partnership with Amazon. As more people invest in AVAX, it is important to understand the technical outlook of the cryptocurrency to make informed trading decisions. In this article, we will be discussing the key support areas, the daily RSI, the weekly chart, and price predictions for AVAX.
Disclaimer: The information and publications are not intended to be and do not constitute financial advice, investment advice, trading advice or any other advice or recommendation of any sort offered or endorsed by Blockzeit. You should consider seeking a financial advisor to check how the website information relates to your unique circumstances.
Technical Outlook
Key support areas
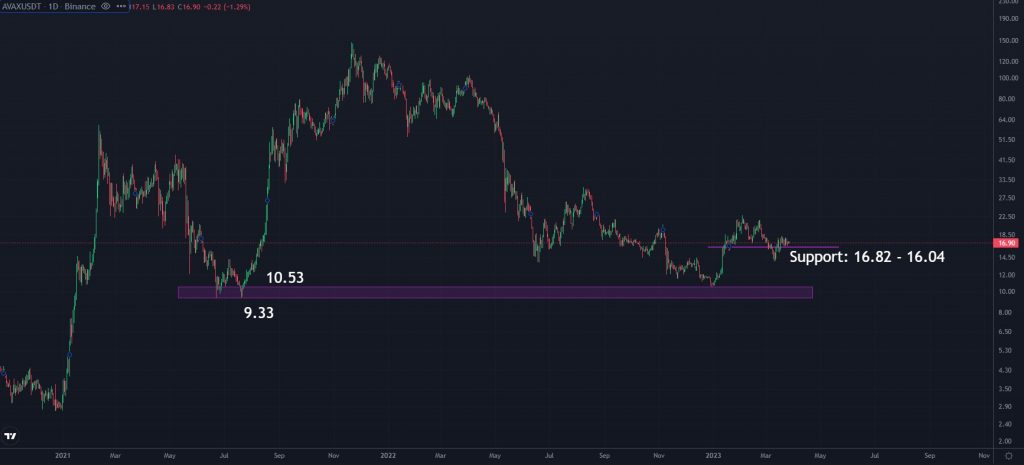
If prices continue to fall, a key major support area to keep an eye on is between $9.33 and $10.53 on the daily chart, where a double bottom was formed in June and July of 2021. The current local low was printed in December of 2022, and it is suggested that we do not drop any lower than that. AVAX is trading between $16.92 and $17 right now, with support around $16.82 and $16.04.
RSI – Daily
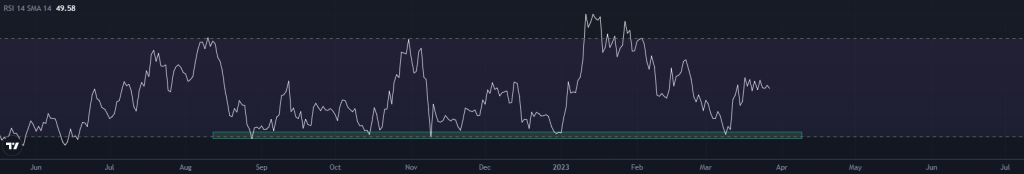
When purchasing AVAX, it is in your best interest to aim your orders at the support blocks located around 30 and 32. This region typically reflects considerable demand for the token. A rebound to the upside occurred once the daily RSI had hit the support block in its trajectory.
Weekly chart
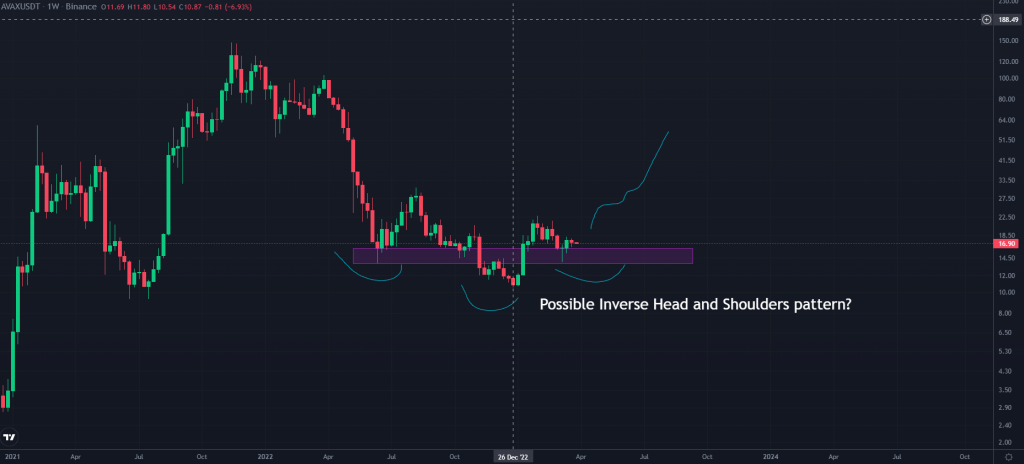
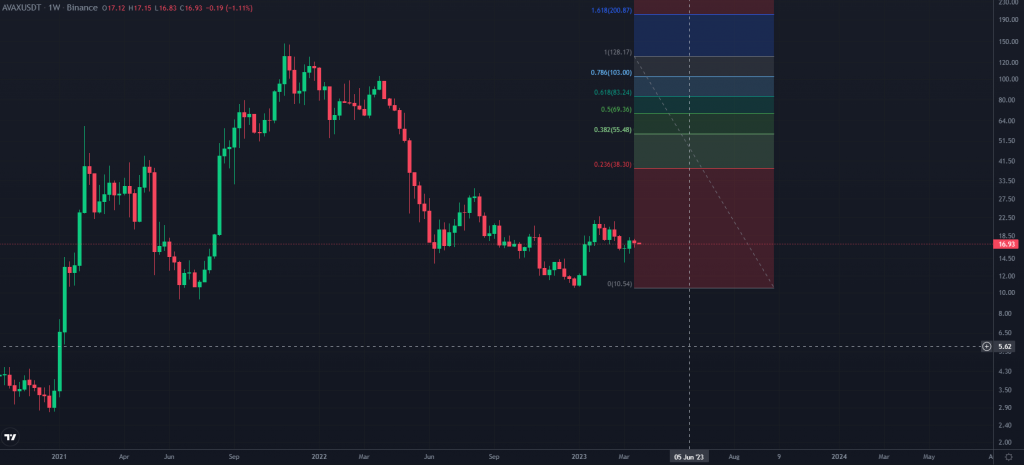
There is a support zone between $16.50 and $13.90 in the weekly chart. As of right now, the price is still above the June 2022 support level. The chart also suggests that an inverted head and shoulders pattern could emerge in the near future.
Price prediction
Throughout this year, I do not expect AVAX to approach its historic highs. Using the Fibonacci Retracement tool, A conservative estimate for the token’s price is the 0.618 fib level, or around $83.
Final thoughts
Ultimately, the key to understanding a token’s technical analysis is the interaction between support and resistance levels. To ensure accuracy, traders and investors should simplify their research and avoid overcrowding charts with too many indicators. Additionally, traders should look for confluence to validate their analysis and increase confidence in their investment decisions.


