
This article is an update from the previous technical analysis of Avalanche (AVAX).
Avalanche (AVAX), like many other cryptocurrencies, has experienced its fair share of price volatility.
In this technical analysis, we’ll examine the daily and weekly charts of the token to gain insights into its current price action and potential future movements.
Daily Chart Analysis
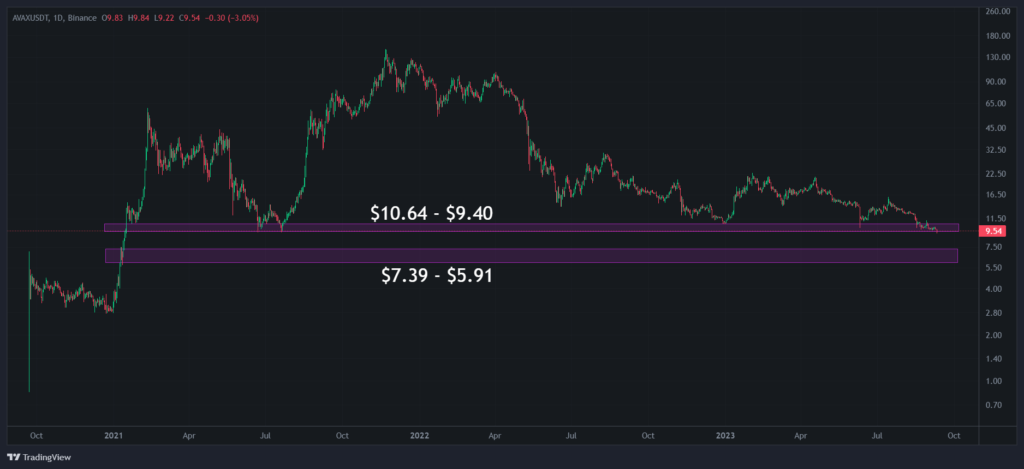
Taking a closer look at the daily chart, it’s evident that AVAX has recently experienced a pullback to a crucial support block that has been in place since the summer of 2021. This support block holds immense significance for the coin’s price trajectory—if it fails to hold, the next potential support levels are around $7.39 to $5.91.
However, it’s essential to consider that this pullback might be a buying opportunity. AVAX has offered similar opportunities in the past, such as in December last year and in June this year. Currently, like many other altcoins, AVAX seems to be overextended, potentially indicating an impending relief rally back to the 20 EMA (Exponential Moving Average).
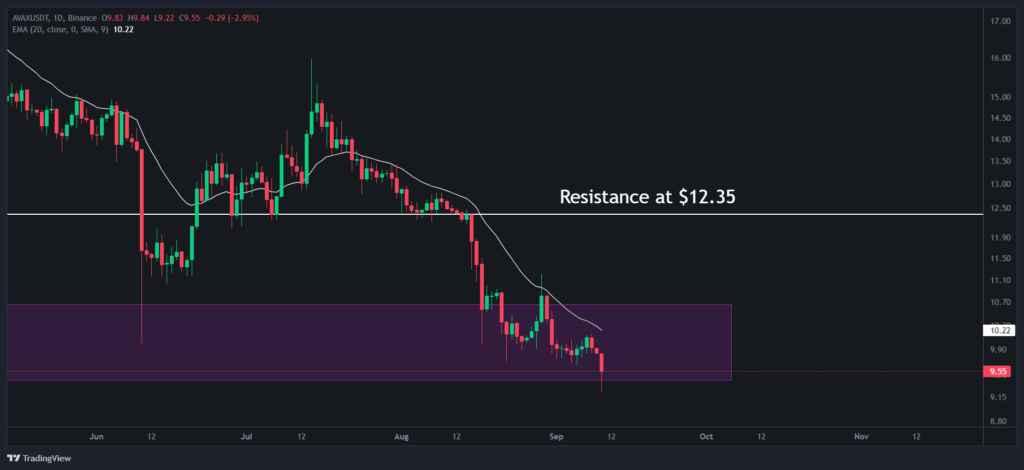
Additionally, a previous support level at $12.35 has now turned into resistance. This level may need to be retested before any substantial upward movement can occur.
Nevertheless, for long-term investors, these short-term fluctuations may not matter, as they focus on the bigger picture and the potential for substantial gains.
Daily RSI
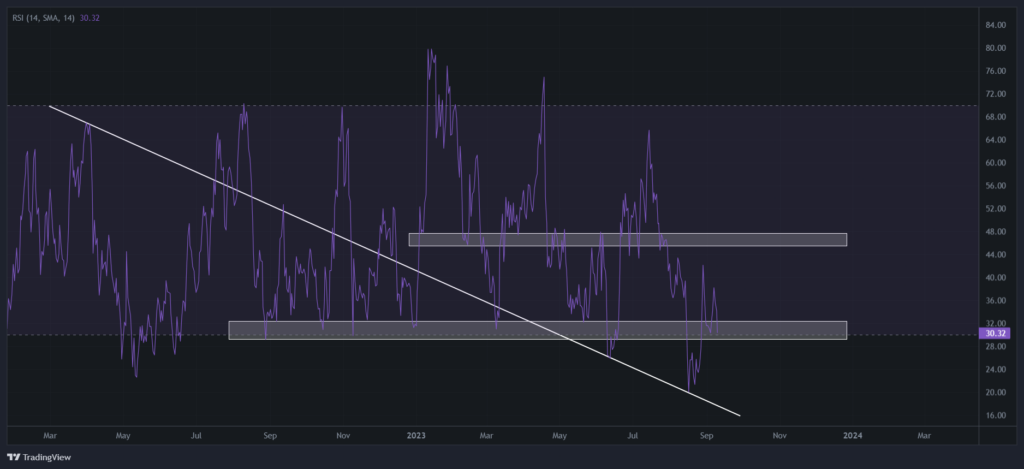
Examining the daily Relative Strength Index (RSI), we observe that AVAX has dipped below a significant support block that had been in place since August 2022. While there was a fakeout in June a few months back, the RSI’s return to this level indicates a possible buying opportunity, especially as it hovers near the oversold index of 30.
Weekly Chart Analysis
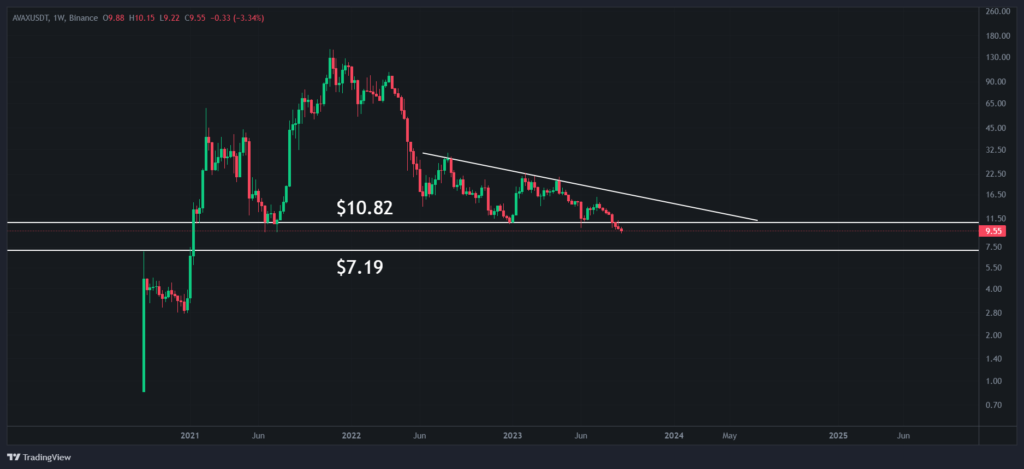
Turning our attention to the weekly chart, we can identify a massive descending resistance trend line dating back to August of the previous year. AVAX has tested this resistance multiple times, suggesting that a breakthrough could signal a bullish trend. Furthermore, the coin has maintained a critical support trend line at $10.82 since January 2021, with periodic retests, reinforcing its significance. However, if this support level is breached, the next technical target stands at $7.19.
Weekly Stochastic and MACD
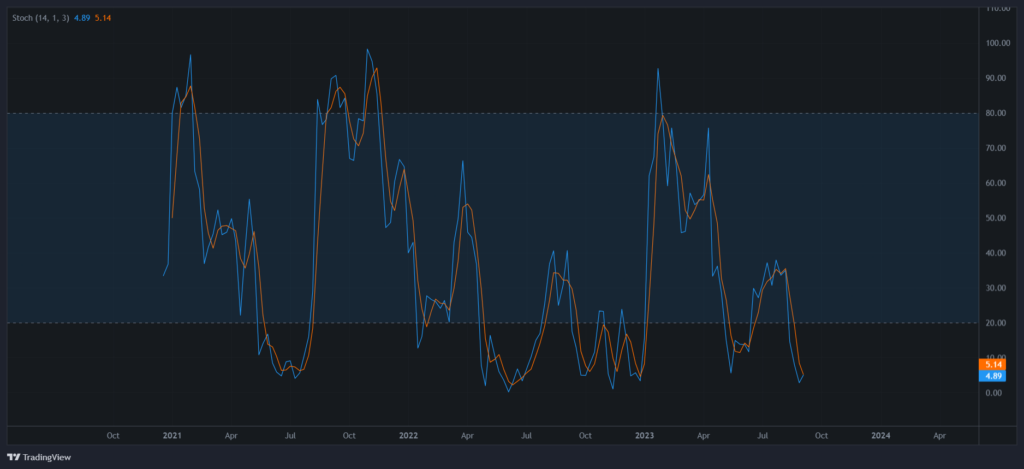
The weekly Stochastic indicator shows that AVAX is already in oversold territory, below the index of 20. This presents an attractive buying opportunity for traders.
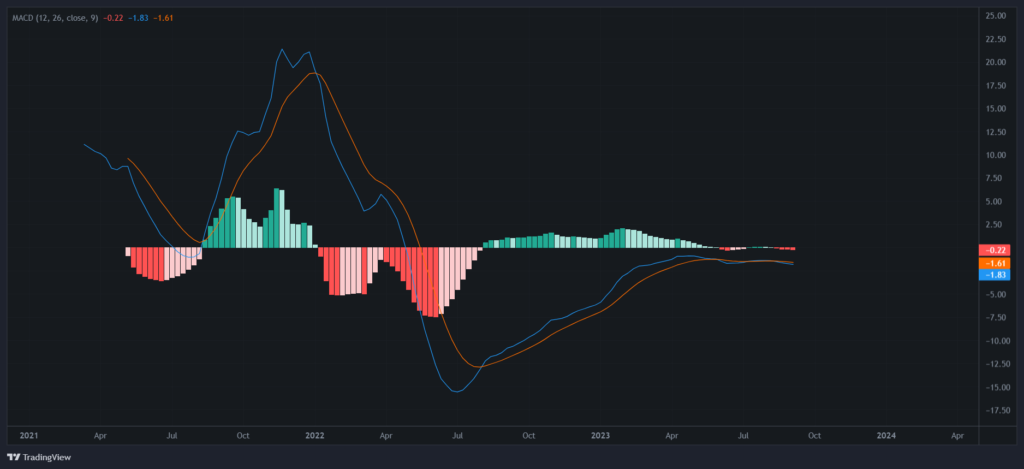
On the other hand, the MACD (Moving Average Convergence Divergence) is displaying a bearish cross, indicating a confirmation of the current downtrend. However, be cautious when relying solely on the MACD, as it is a lagging indicator.
Final Thoughts
In conclusion, AVAX appears to offer opportunities for both short-term traders and long-term investors. A decisive break above the August 2022 high could signal the end of the bear market phase for the token. However, remain cautious until this breakout occurs, as most altcoins are still trapped in a massive downtrend since the August lows.
The key takeaway here is the importance of setting clear profit targets and adhering to a well-defined trading plan, rather than trying to predict market tops. AVAX’s future trajectory will depend on its ability to break through critical resistance levels, and until then, traders and investors should exercise prudence in their approach.


