The article provides a technical analysis of Toncoin (TON) following its recent surge driven by Telegram’s endorsement—examining key charts and indicators to assess the token’s current status and potential future movements.
With the Telegram endorsement of the TON project potentially drawing more users into the crypto space, Toncoin (TON) has gained significant attention in the crypto community.
After a surge of 40% following the announcement in previous weeks, let us analyze TON’s technical aspects to determine its future trajectory.
Daily Chart
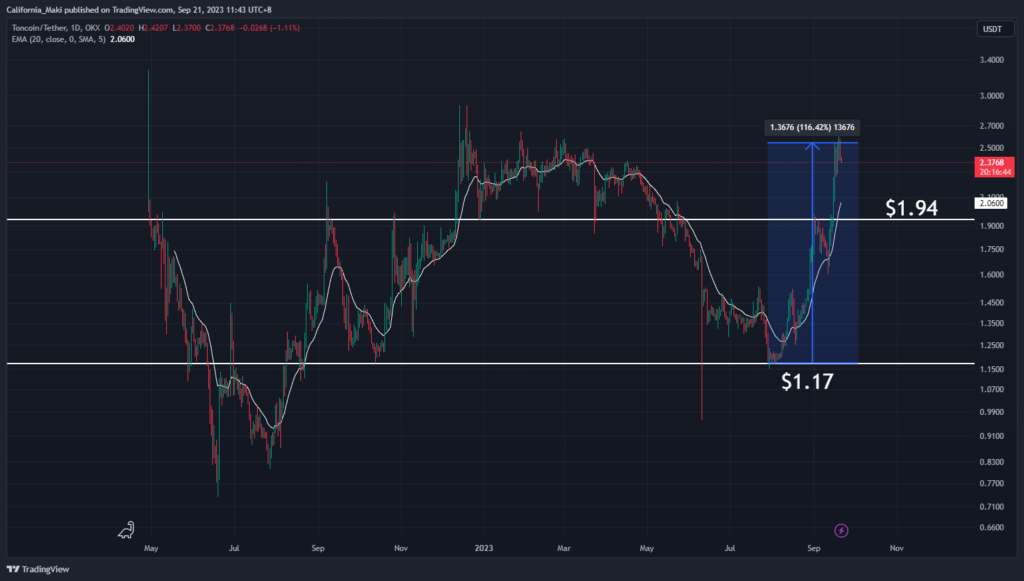
Analyzing the daily chart, it is evident that TON began an upward trend from its August low of $1.17, resulting in a remarkable 116% increase. During this uptrend, TON occasionally dipped below the 20-day exponential moving average, offering attractive buying opportunities. These dips occurred in mid-August and early September, leading to a 60% increase from the second dip.
Currently, TON faces immediate support at $1.94, a level that historically has played a significant role as both resistance and support. The recent August 2023 low aligns closely with lows from October 2022, August 2022, and May 2022, underlining its importance.
Daily RSI
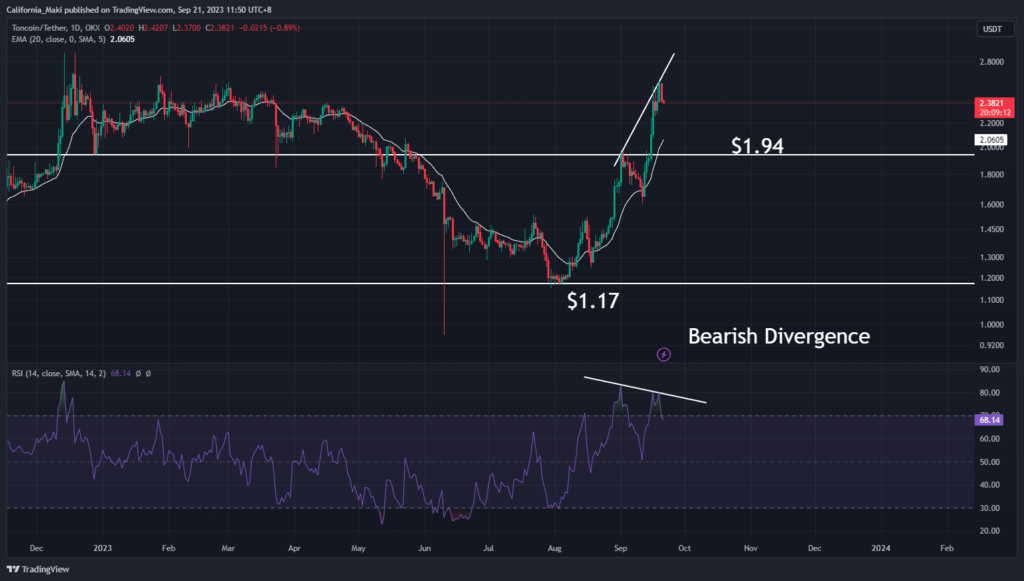
Examining the daily Relative Strength Index (RSI), a bearish divergence is emerging—while TON experienced a higher high in September, the RSI displayed a lower high. This bearish divergence often precedes a pullback. Considering this divergence, the overextension from the 20-EMA, and the absence of a retest of recent resistance as support, a retracement to $1.94 becomes a plausible scenario before attempting to break the all-time highs.
Weekly Chart
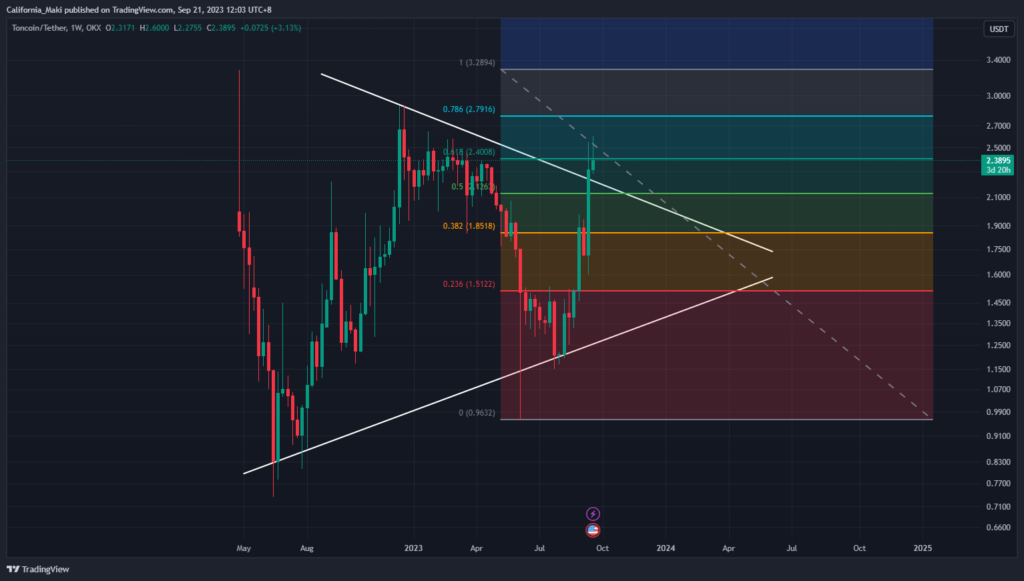
On the weekly chart, TON is showing strength by breaking out of a symmetrical triangle pattern. However, a crucial challenge lies ahead—the golden ratio at $2.40. Breaking above the golden ratio is a bullish sign and often precedes a retest of the all-time high.
A potential scenario could involve retracing below the 0.5 Fibonacci level, retesting the resistance as support, and then aiming for a move towards the upside, ultimately breaking the 0.786 Fibonacci level.
Weekly RSI, Stochastic, and MACD
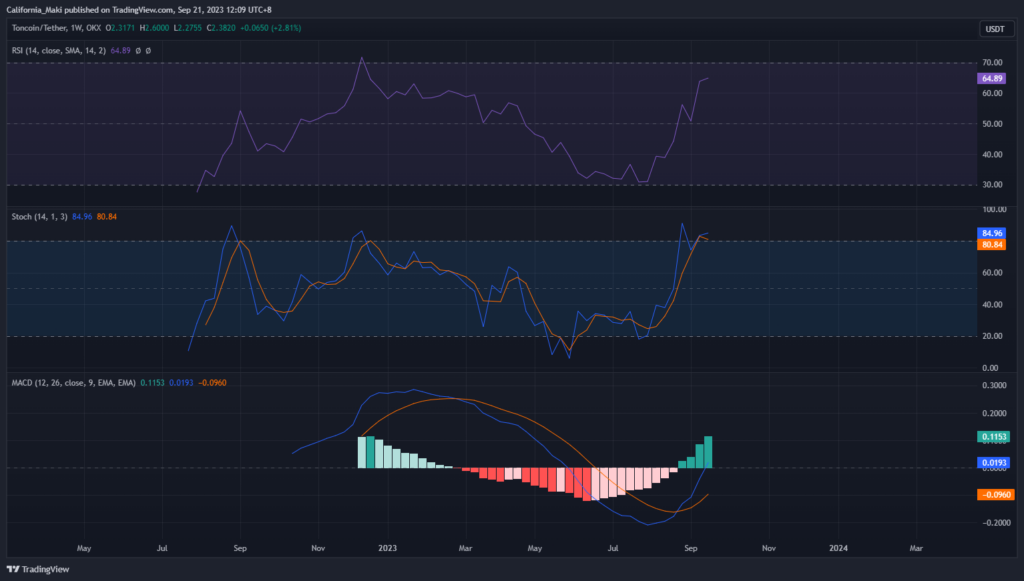
The weekly RSI is on track to enter the overbought region in the coming weeks, while the stochastic is already overbought. The MACD indicator is also becoming overextended.
Historical data shows that when these indicators reached similar levels in December 2022, a subsequent pullback occurred. This suggests that TON might experience another pullback or correction in the future.
Maintaining a healthy uptrend involves periodic bounces off the 20-EMA. Even if TON retraces to $1.80, it may not necessarily be a negative development, as it could still remain within the established support trendline.
Final Thoughts
In conclusion, TON has experienced substantial growth, driven in part by the Telegram endorsement. However, technical analysis suggests potential challenges ahead. Investors should monitor the mentioned key indicators but it’s important to stay cautious and prepare for potential pullbacks or corrections in the future. As always, please conduct further research and exercise caution before making any investment decisions.


