
The article provides a technical analysis of The Graph (GRT) cryptocurrency, highlighting its recent price movements, support and resistance levels, and the potential for accumulation amid market volatility.
The Graph (GRT) has experienced significant volatility in recent months, with notable price fluctuations and several key technical developments on both the daily and weekly charts.
In this technical analysis article, we will break down the important aspects of GRT’s price action and indicators.
Daily Chart Analysis
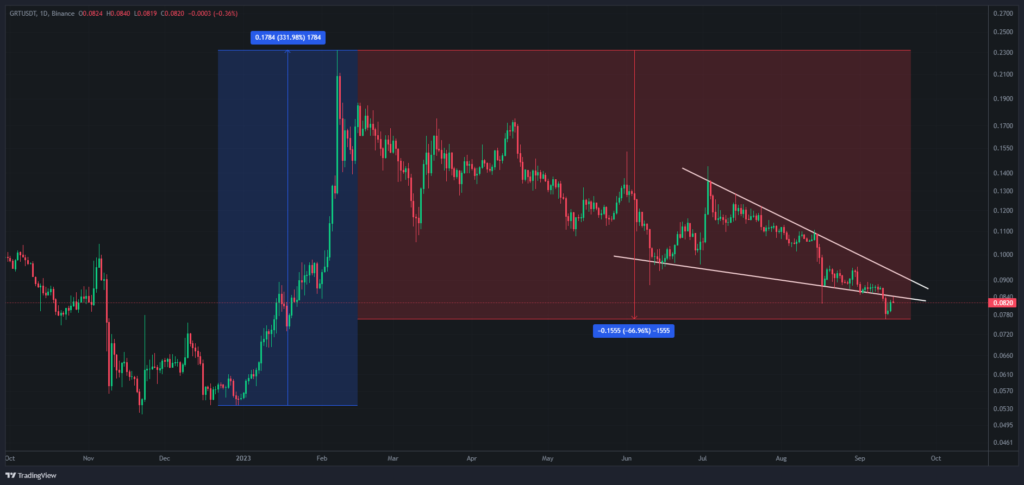
GRT witnessed substantial gains during the January AI hype cycle, with a 4X increase in value. However, since the peak in February, the coin has retraced approximately 67%. This presents an attractive opportunity for accumulation and dollar-cost averaging, particularly for those whose average buy-in price is above $0.40-$0.50. It is essential to exercise caution and avoid buying all at once, given the possibility of further downtrends and the loss of key support levels.
A falling wedge pattern emerged on the daily chart with an initial target at $0.135. However, the pattern became invalidated in September as GRT lost support, making this target obsolete. Additionally, the coin broke below a significant support level at $0.0876, which had acted as a bottom in July 2022.
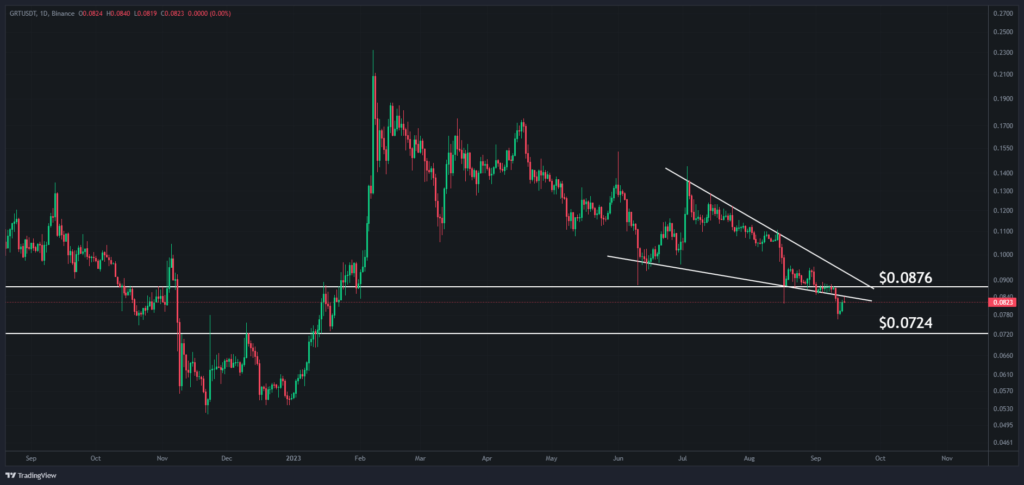
The next support level to watch is at $0.0724, a critical level due to its previous role as resistance in December 2022, which GRT broke above in January. The absence of a backtest of this level as support may indicate a potential scenario for further downward movement.
Despite the recent pullback, GRT remains one of the top AI projects, making it a relatively safer investment within the AI niche. The current price levels offer an opportune entry point for those looking to build their positions, especially if prices drop further, reducing the average buy-in cost.
Daily RSI
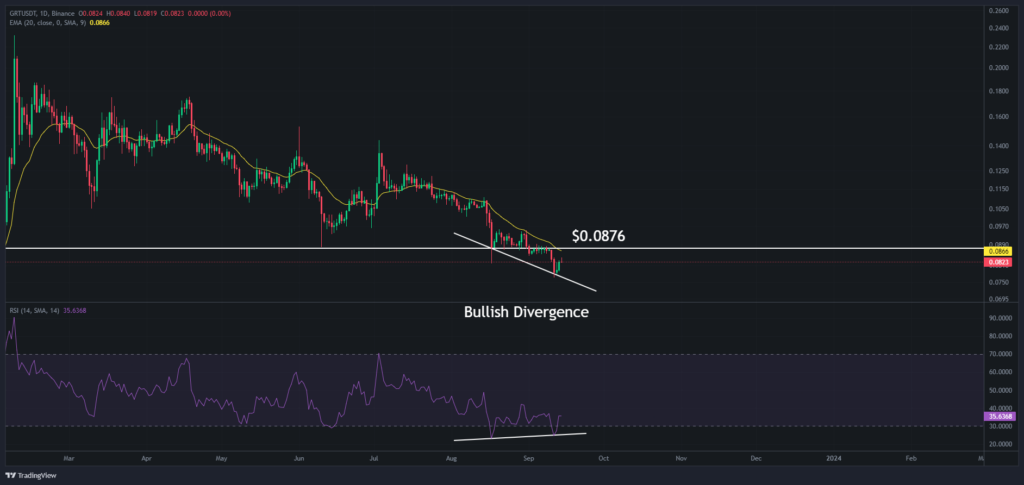
The Daily RSI dipped into oversold territory twice in the past month, historically a good accumulation signal. A bullish divergence is also forming, with the RSI printing higher lows while price action prints lower lows.
The extent of the bullish divergence correlates with the size of the potential upward move. Typically, once a bullish divergence is confirmed, we anticipate an upward price shift. In this context, the ongoing back test could potentially propel us towards the 20 EMA or even retesting the $0.0876 resistance.
Weekly Chart Analysis
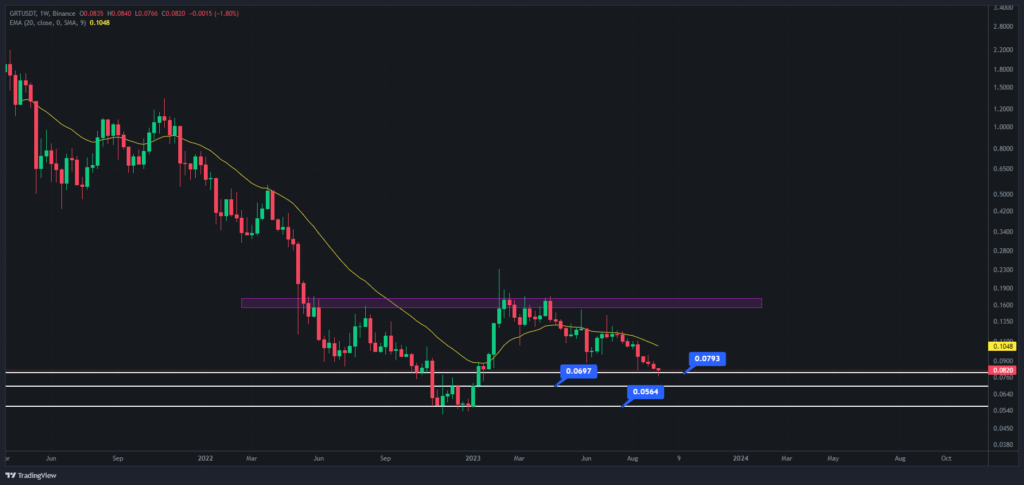
On the weekly chart, GRT has faced rejection from the 20 EMA, with multiple backtests of resistance in May and July. The recent breach of the June 2022 low is a negative sign indicating a lower low. The next support to monitor is the level it previously held in October 2022. The current price range presents an opportunity for accumulation, as a potential relief rally to the 20 EMA could offer a 32% upside.
A significant resistance block between $0.15 and $0.17 has proven challenging for GRT to break above, with multiple rejections in 2022 and 2023. A successful breach of this resistance zone could indicate that the market has found a bottom. However, it’s essential to remain cautious, as further downward movement is possible, potentially revisiting the January 2023 low.
Final Thoughts
In conclusion, GRT is undergoing a period of volatility and uncertainty. While there are potential opportunities for accumulation and short-term trading, investors should exercise caution and stay prepared for further price fluctuations. Diversifying your portfolio and adopting a long-term perspective can help navigate the challenges of this dynamic market.


