
This article conducts a technical analysis of Quant (QNT) by examining its daily chart, key support areas, daily and weekly RSI to understand its price trend and predict potential future price movements.
Quant (QNT) is a blockchain-based project that aims to solve interoperability issues among different blockchain networks. The project’s main goal is to create an operating system for decentralized finance (DeFi) that can connect various blockchain platforms and enable seamless communication and transfer of assets between them.
In this article, we will be conducting a technical analysis of QNT to understand its price trend and predict where it might be heading in the future.
Daily Chart
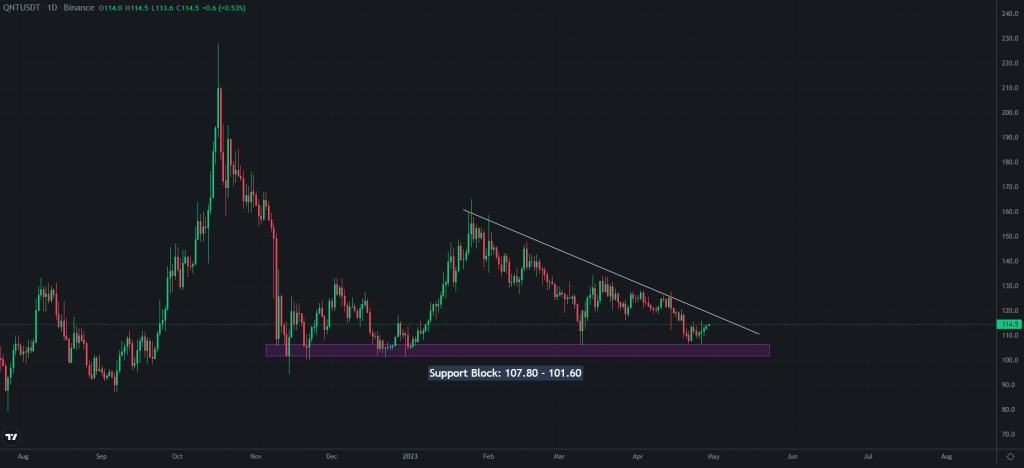
Taking a look at the daily chart, we can see that there is a support block set up between 107.80 down to 101.60. This support level is based on all the local lows that have been printed since November of 2022. We can also see a descending resistance trend line, and every time the price comes up to test that trend line, it fails to break out, resulting in another move down.
The more a level is tested, the higher the chance of breaking out. However, we find ourselves in a descending triangle pattern, which typically predicts a break to the downside. At some point, the support will crack because it cannot hold the weight of the resistance. If that happens, we have to look at some local lows to target.
Key Support Areas
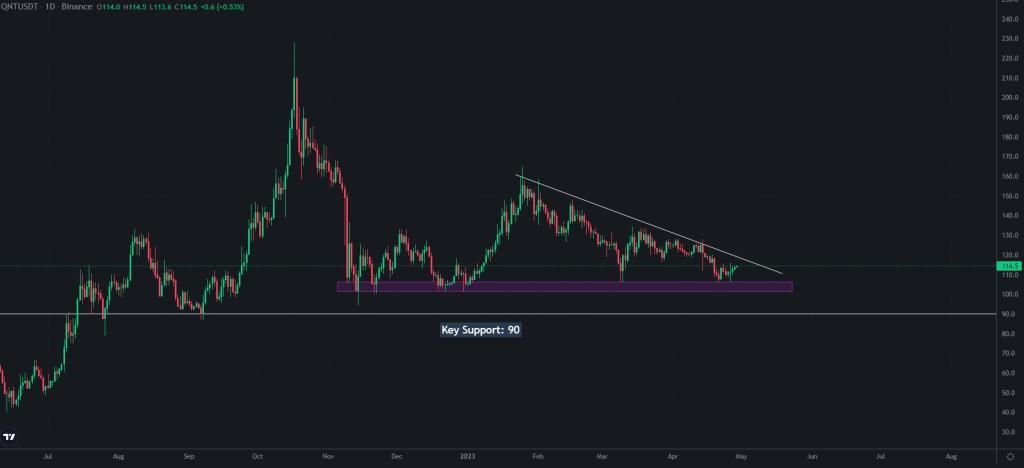
90 is going to be a significant support for QNT. The token back tested it as resistance in July and as support in January of 2022. If we break below the support block, this is an important support that we want to hold.
On the contrary, if we break out, which is unlikely, we could break to the upside and have a backtest of the support of the previous resistance and continue from there. If that happens, we would have to break above our January 2023 high because if we print a lower high, we come back down crashing towards the trend line once again. This is a negative thing because the chart will continuously be printing lower highs.
RSI – Daily
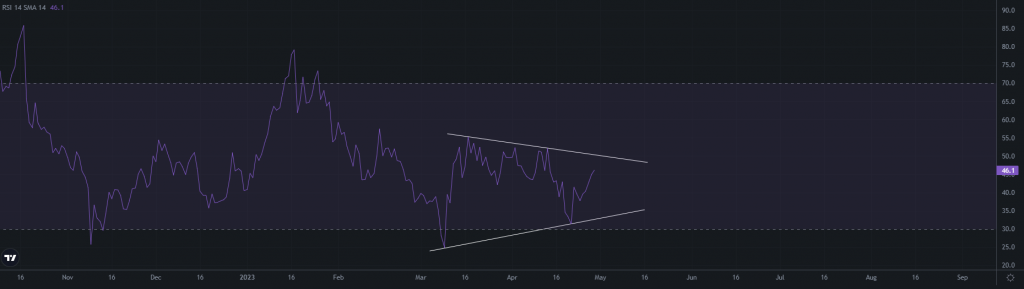
Taking a look at the daily RSI, we can see that we are in some sort of asymmetrical triangle. If we have another pullback, we could be looking at the support trend line to hold us, which would be a nice buying opportunity.
RSI – Weekly
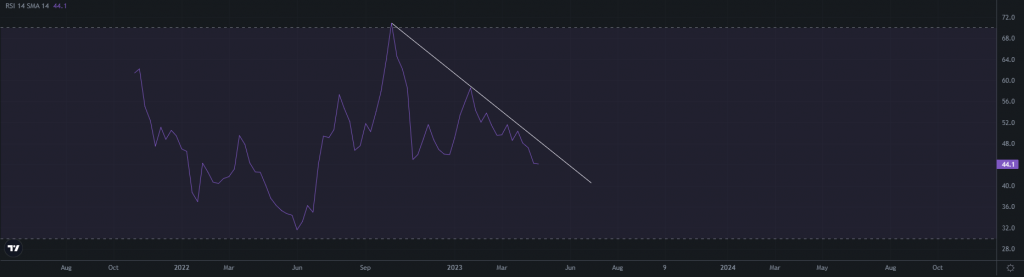
When we break above the weekly trend line, that is going to be massive for the token’s price. However, the RSI is pulling back down, and we are at the index of 44. We need to keep this in mind.
Final Thoughts
Quant (QNT) is currently in a descending triangle pattern, which typically predicts a break to the downside. However, if the support holds, we could potentially see a backtest of the previous resistance and a continuation from there. It is important to keep an eye on the key support areas and the weekly RSI to predict any potential price movements in the future.


