
This article will delve into the daily and weekly charts of MATIC, aiming to provide insights into its current price movements and potential future developments.
Despite the promising project narratives that were announced in the past few weeks, Polygon (MATIC) continues to be in a downward trend.
This article presents an updated technical analysis of the native token, aiming to shed light on its future movements.
Daily Chart
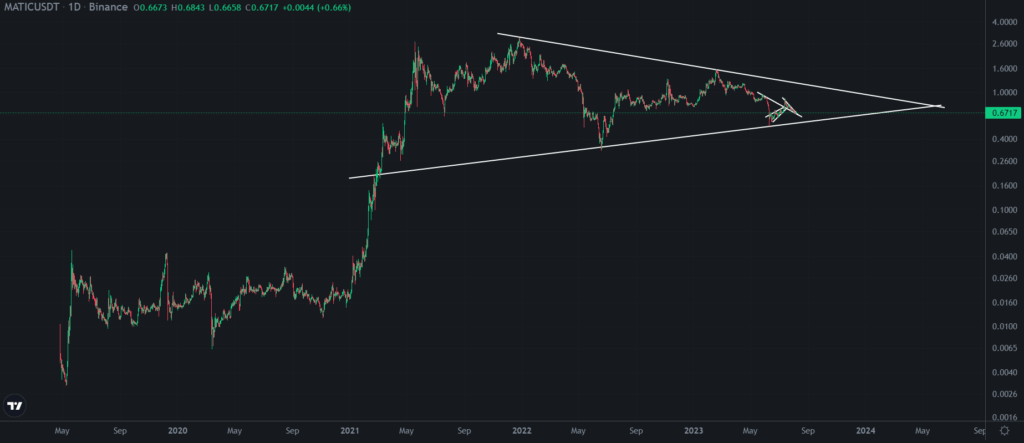
Taking a look at the daily chart, it becomes evident that MATIC is trading within a large symmetrical triangle, which can also be interpreted as a bullish pennant pattern. This formation is characterized by higher lows supported by an upward sloping level of support and lower highs resisted by a downward sloping level of resistance. The convergence of price within this range is expected to lead to a breakout.
Interestingly, the projected breakout is anticipated to occur around late April 2024, coinciding with the Bitcoin halving event. Historically, such halving events have triggered a bullish phase in the overall market, potentially providing further momentum for MATIC’s price movement.
Traders can mark these support and resistance lines on their charts. In case of further price declines, the key level of support is identified around $0.56 – $0.54.
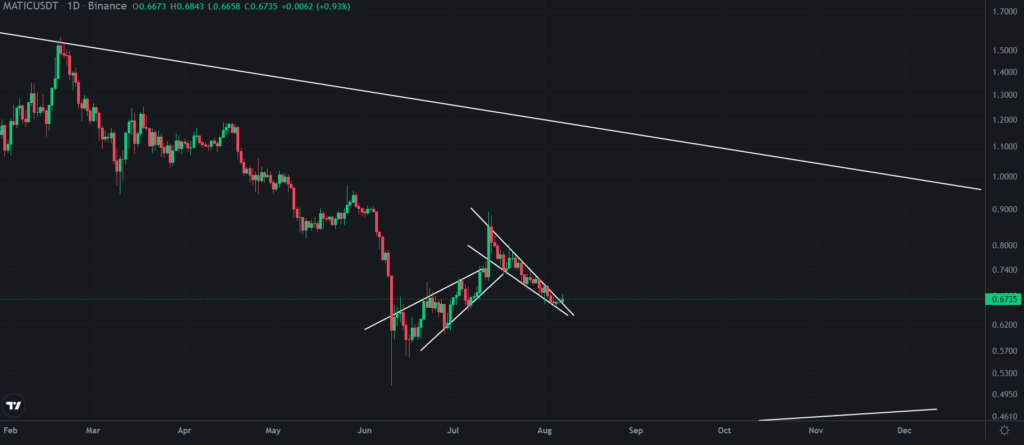
The price action since the second half of February 2023 has been in a downtrend. Notably, there was an impulse to the downside in June, forming an ascending wedge pattern. While this pattern typically breaks to the downside, the price unexpectedly experienced a pump. The current formation indicates a descending wedge, which suggests the likelihood of an upside breakout.
Daily RSI
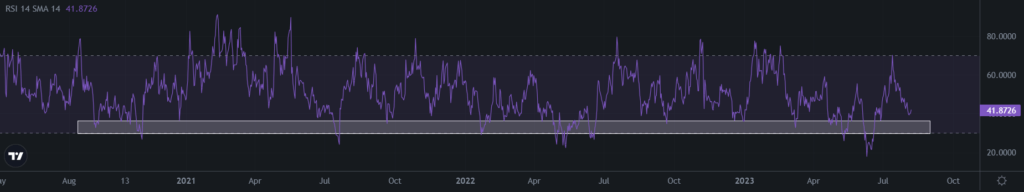
The daily Relative Strength Index (RSI) provides valuable insights for potential entry points. Based on historical data, the optimal time to enter a position in MATIC is when the RSI falls within the range of 36 to 30. In multiple instances, MATIC has bounced off the support block around these levels. Occasionally, the RSI may dip below the support block briefly before recovering, indicating potential buying opportunities.
Weekly Chart
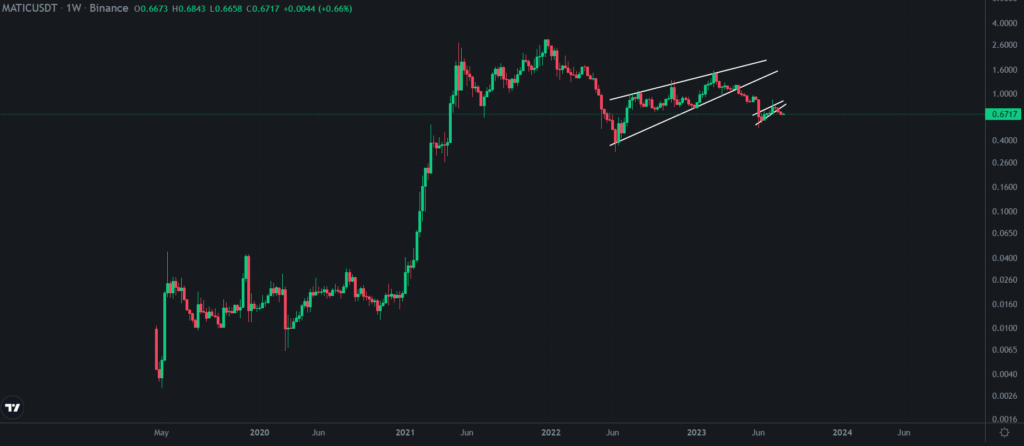
Turning to the weekly chart, MATIC’s price action is forming an ascending wedge pattern, which recently experienced a breakdown. While the daily chart suggests a bullish descending wedge pattern, the weekly formation appears bearish with the ascending wedge.
Weekly Chart Key Support
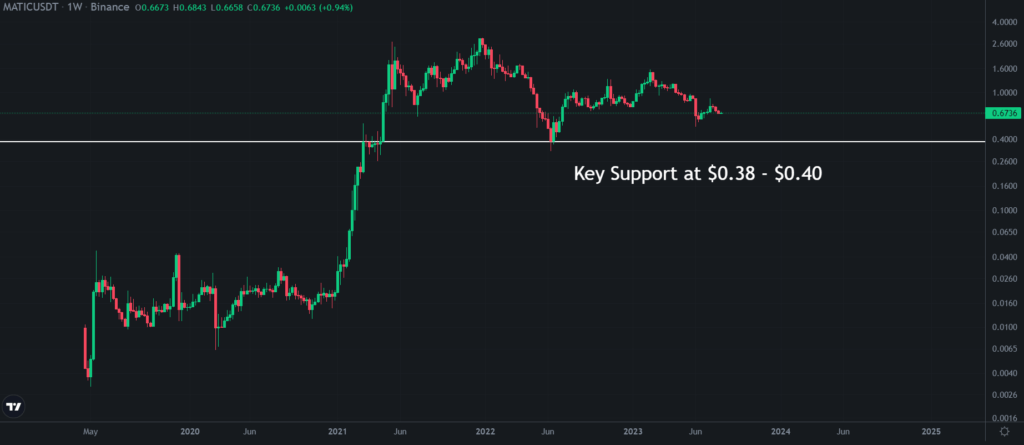
In the event of a further downward price movement, the key support level for MATIC is expected to be between $0.38 to $0.40. This price range served as resistance during March to April 2021 and subsequently turned into support in June 2022, further emphasizing its significance.
Final Thoughts
The technical analysis of Polygon (MATIC) indicates a potentially significant price movement in the future, as it is currently trading within a macro bullish pennant.
However, it is crucial to be mindful of the weekly ascending wedge breakdown, which may pose bearish implications if not addressed by an upside breakout from the descending wedge on the daily chart.
As always, traders should conduct further research and exercise caution before making any investment decisions.


