
In an unexpected twist, the Bitcoin juggernaut has hit a speed bump. The once seemingly unstoppable cryptocurrency has taken a break from its six-month uphill climb. The sudden downturn has sent tremors across the financial markets, with investors and enthusiasts alike waiting with bated breath.
Is this just a simple market correction or a warning sign of an upcoming crypto winter? The next few days will answer these burning questions. Let’s dive in and analyze the charts.
Previous Bitcoin Price Analysis
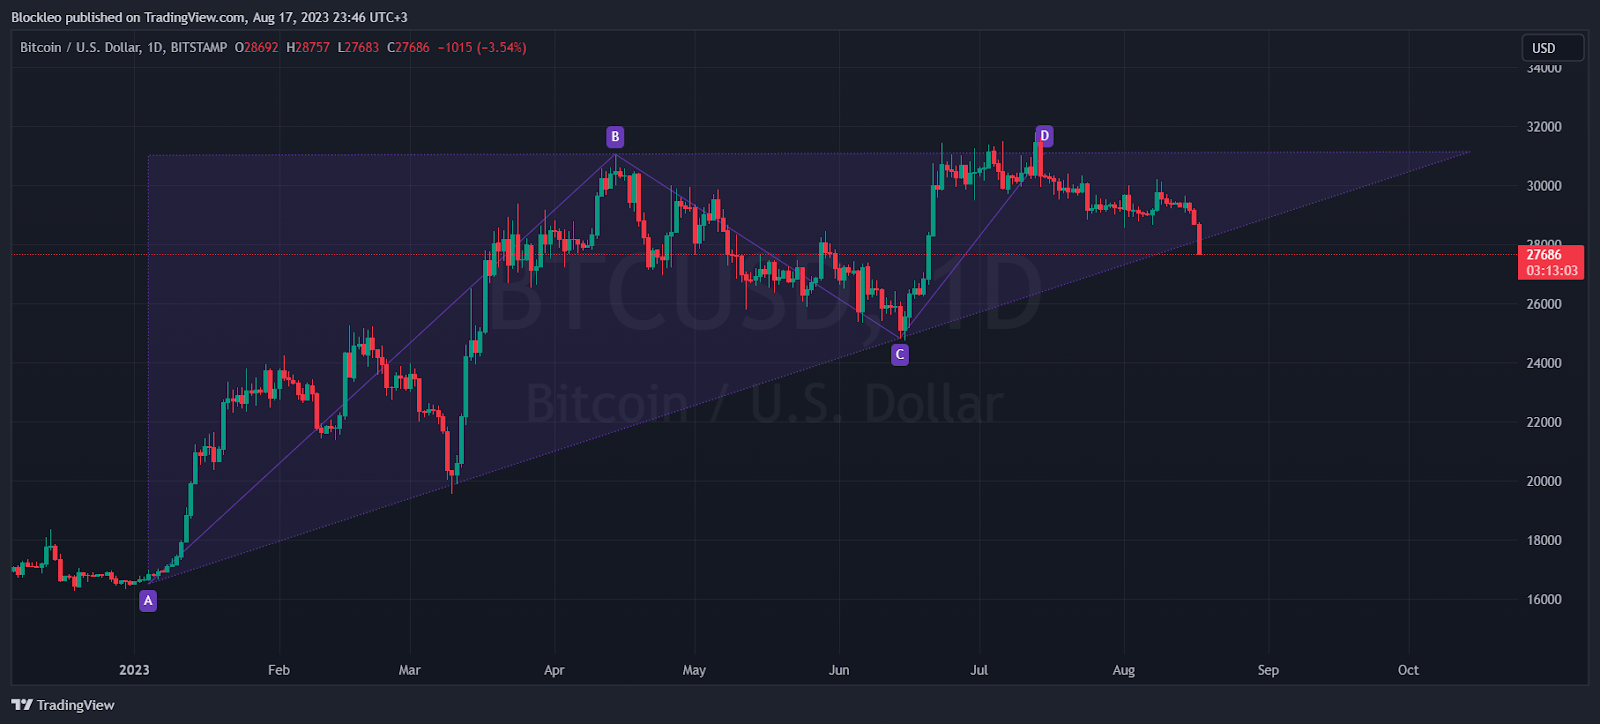
Last week’s analysis saw Bitcoin still trending inside the 6-month ascending triangle. The initial prediction was that the price would follow the generally accepted outcome of ascending triangle chart patterns – Bullish.
However, a Bitcoin sell-off triggered on August 17 caused the asset to slip below the lower trendline of the ascending triangle. If the daily candle for August 17 closes below this trendline, investors should get concerned since it would be an indicator of red markets in the future.
Price Analysis
Bitcoin is currently trading at $26,444 as at the time of writing (August 18, 2023 07:32 AM UTC). Despite the asset breaking down from the ascending triangle, Bitcoin is still trending above the 200-day moving average. Over the last three days, the asset has droped -10.73%, effectively going below the 50-day moving average.
Since the Golden Cross in early February 2023, the price has been testing the 200-day moving average, trying to break through to the downside. However, it has not been able to. In early March, there was a quick V-shaped false break out that left a lot of Shorts liquidated. Since February, the price has tested the 200-day MA twice, with this recent one being the third one.
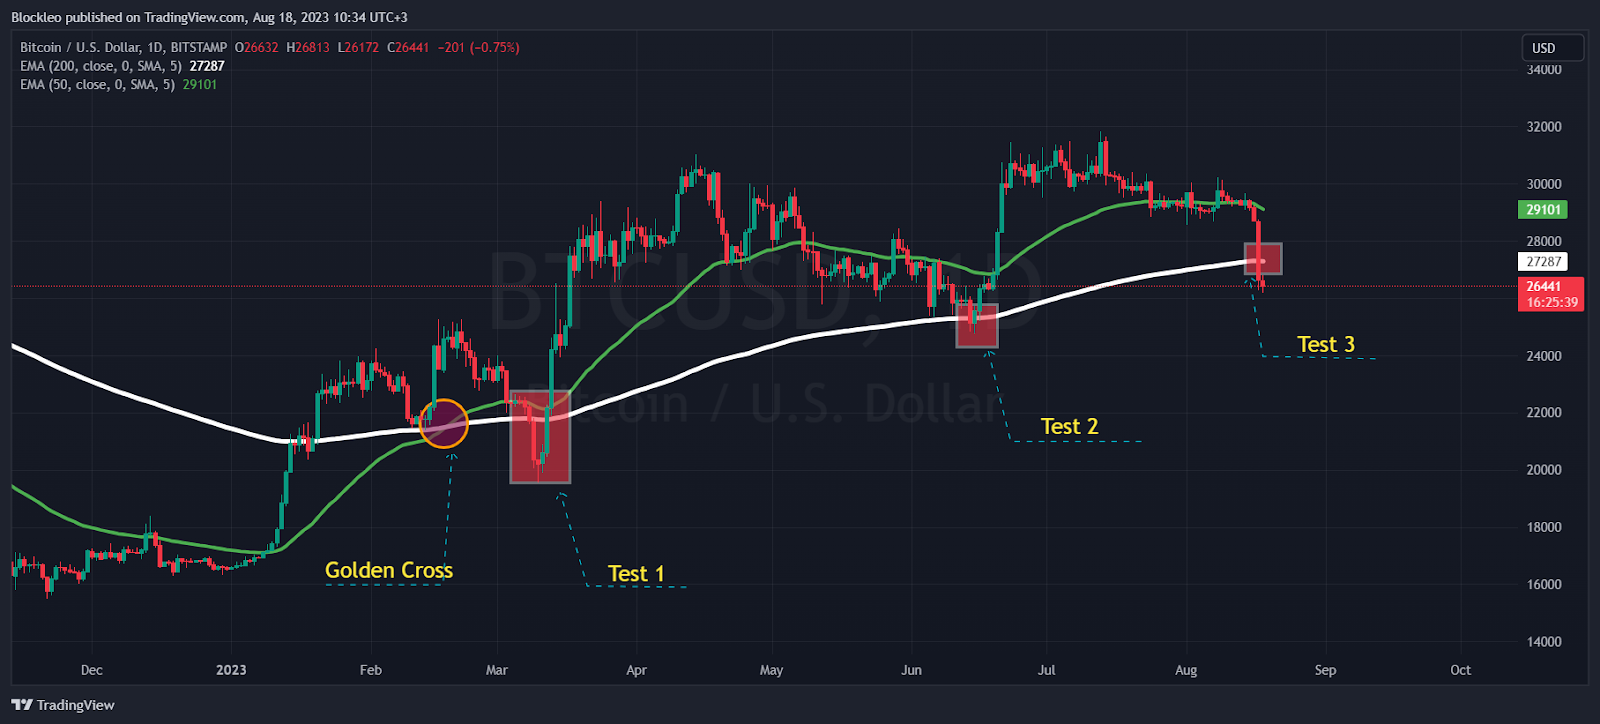
Bitcoin bears on August 17 managed to force the price to close below this macro-indicator. The last time it did this there was an immediate reversal as mentioned previously. This time around the general market sentiment is bearish and Bitcoin may drop to $25k, and in a worst-case scenario, to $21k.
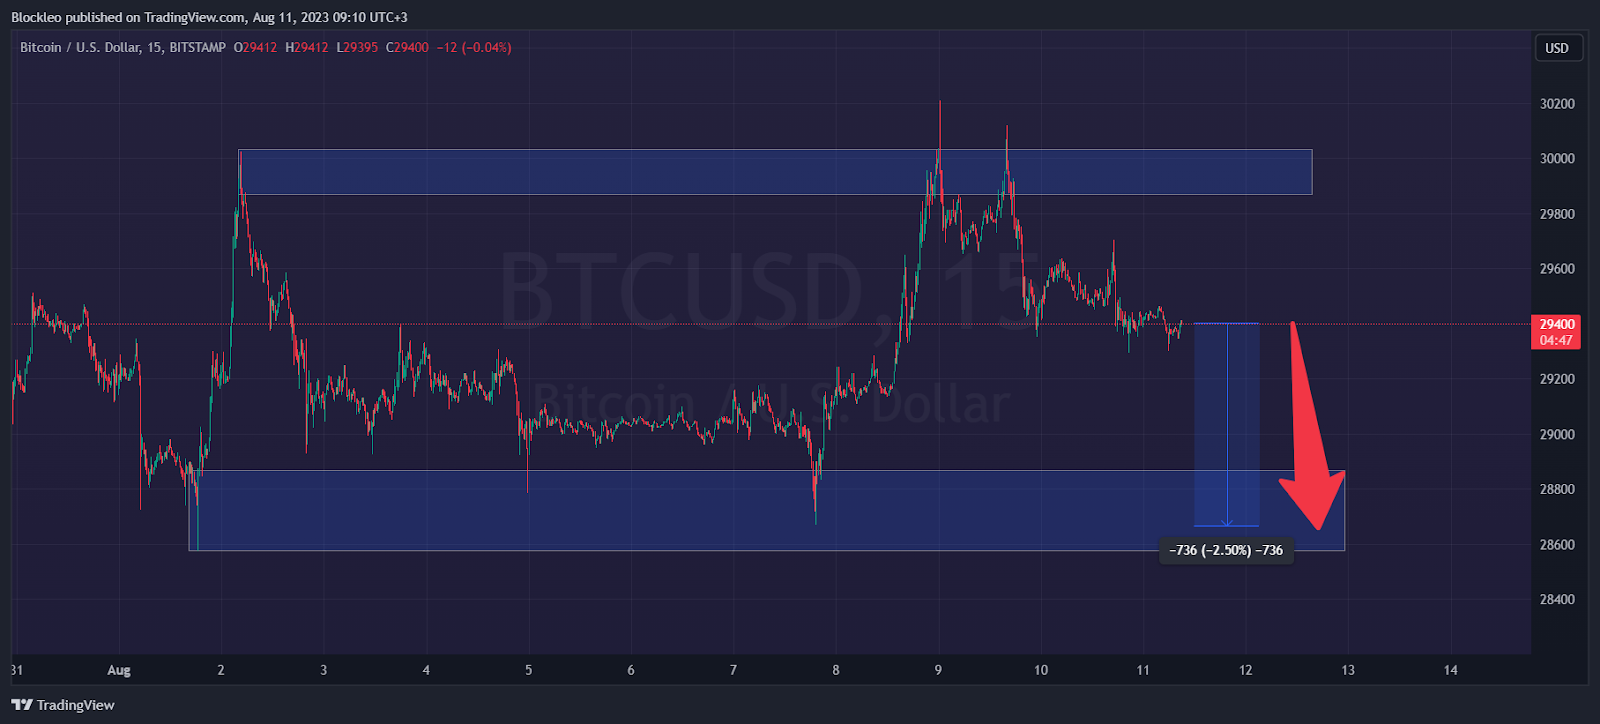
For the short-term traders, last week’s call was a success, although it took three days to hit the target. In the coming week, traders should expect the downward trend to continue.
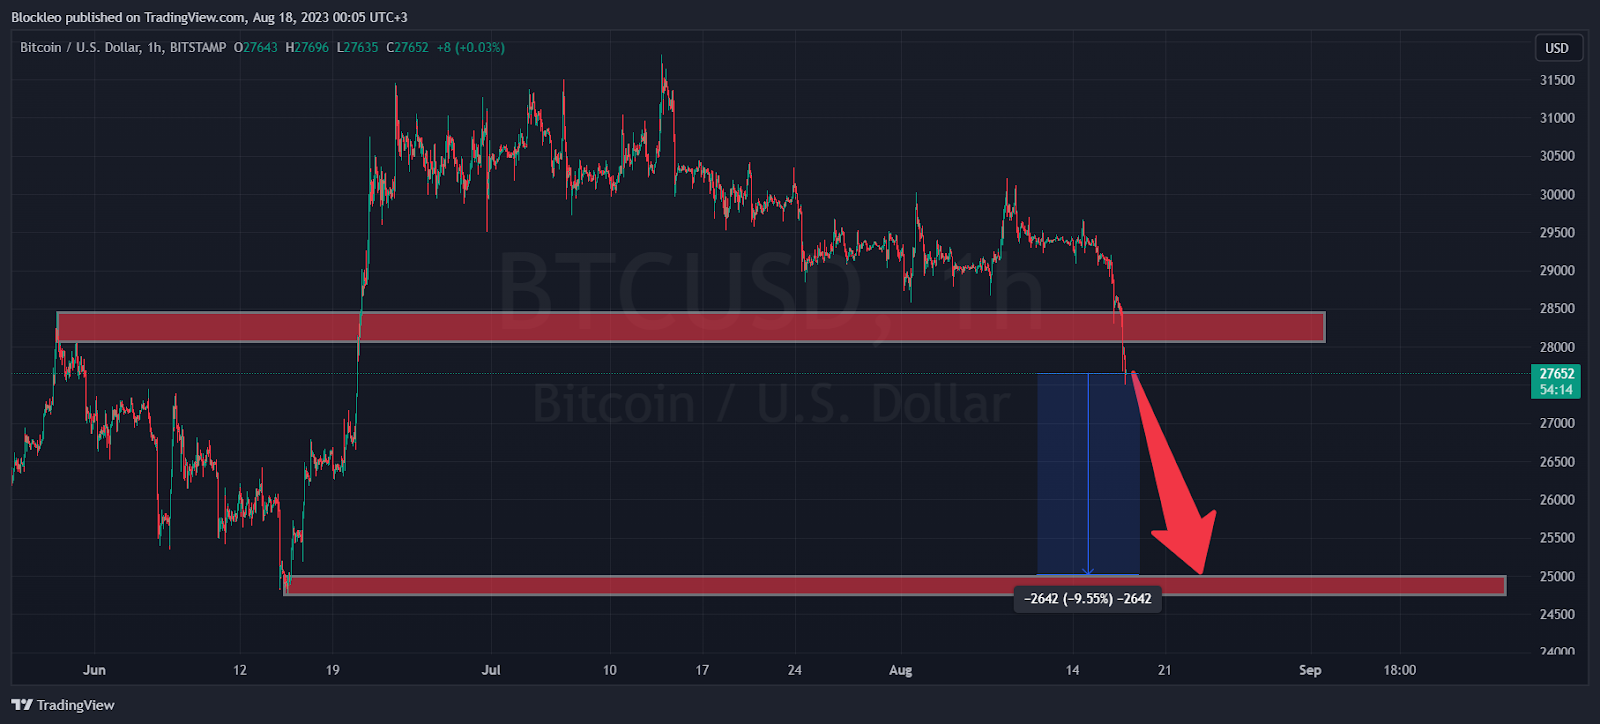
Bitcoin price already broke through a previous weak support (which may become a resistance in the future). Bulls may be expected to try and push the price back up and test $28,000 – $28,500.
However, the power of the bears is currently stronger. Bitcoin is looking at a -9% drop from the current price over the next few days. This will leave it sitting at $25,000. A 10X Short could yield +90% profit on this potential setup.
DISCLAIMER: The work included in this article is based on current events, technical charts, company news releases, and the author’s opinions. It may contain errors, and you shouldn’t make investment decisions based solely on what you read here.


