
In this technical analysis article, we will delve into the current state of Fantom (FTM) by analyzing its daily and weekly charts, as well as key technical indicators. We will identify crucial support and resistance levels, discuss potential price movements, and provide insights to help traders and investors make informed decisions.
Daily Chart Analysis
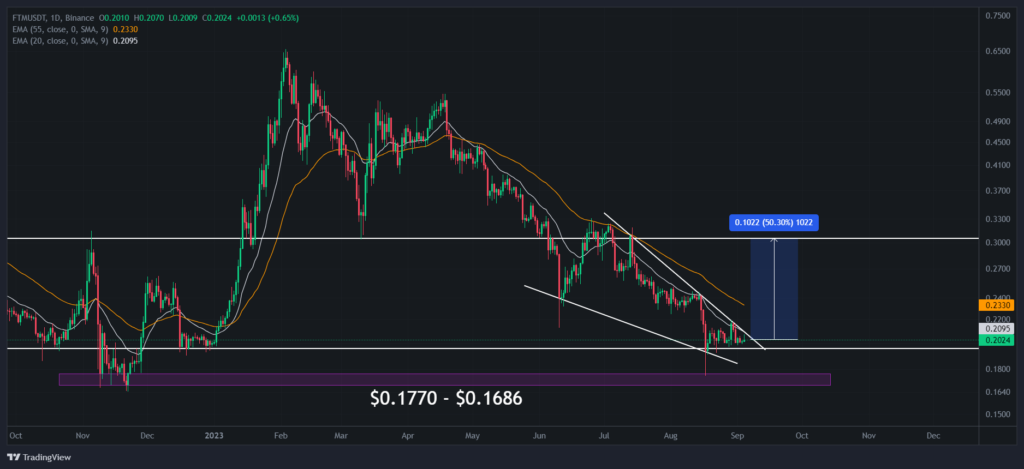
Starting with the daily chart, we can see a significant support zone established between $0.1770 and $0.1686, formed since November 2022. Recent price action indicates strong buying pressure when approaching this support area, particularly below $0.19. Additionally, there is a noticeable falling wedge pattern, a bullish reversal pattern characterized by two support and resistance touches. This suggests a 75% probability of a breakout to the upside, with a technical target at $0.305. This represents a 50% potential price increase from the current level.
For traders, a strategy to consider is waiting for a breakout and entering a position at that point, possibly following a successful backtest. However, there remains a 25% chance of invalidation, leading to a potential drop in price. The immediate support below the wedge is at $0.195, which has shown substantial demand in the past.
Should prices decline further, a critical level to watch is the July 2021 low at $0.16. Falling below this support could trigger a more significant downtrend, potentially revisiting the September 2020 resistance level.
Weekly Chart Analysis
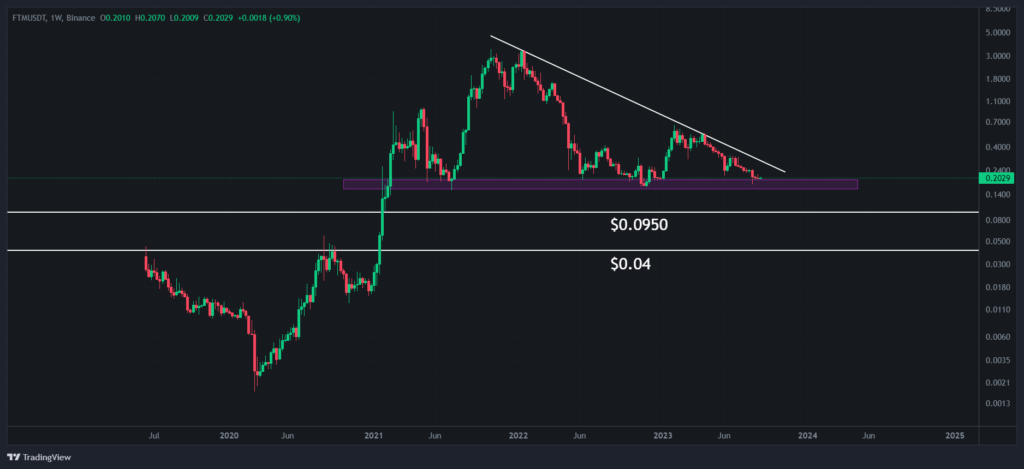
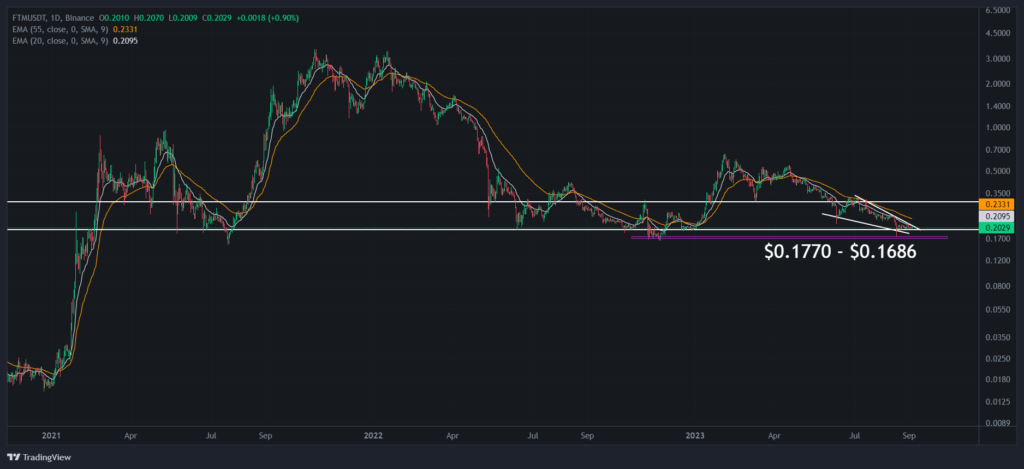
Moving to the weekly chart, it is concerning to note a consistent pattern of lower highs, indicating a potential weakening trend. There is a horizontal support level, but the possibility of a breakdown should not be ignored. If this support fails, the next level to watch is at $0.095. However, these are possibilities, not certainties.
The weekly chart also reveals a descending triangle, which is a bearish pattern. While breakdowns are possible, we hope for a breakout, especially considering that we are approaching the apex of the triangle.
Weekly RSI Analysis
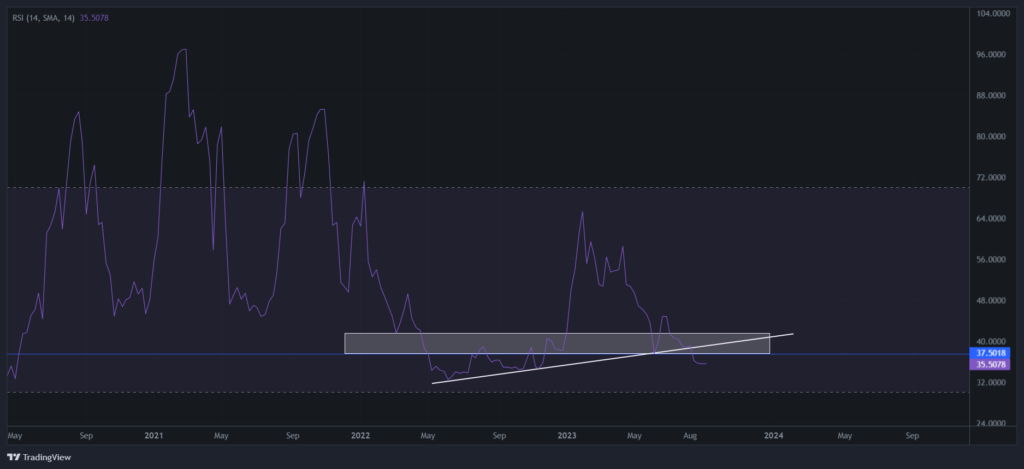
Examining the weekly RSI, we observe the loss of a critical support level that had been holding since May 2022. This suggests a potential downtrend. If the RSI falls to around 34.2, it may indicate oversold conditions, potentially presenting a buying opportunity.
Weekly Stochastic Analysis
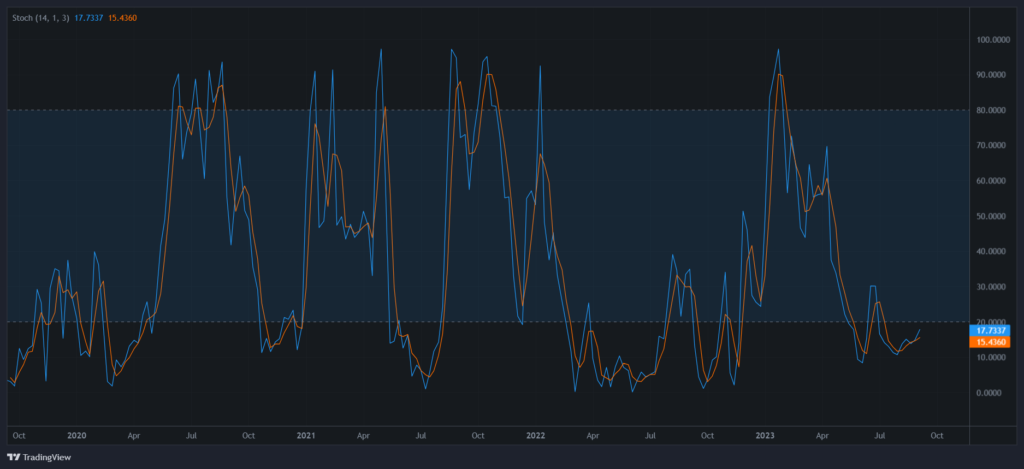
Contrastingly, the weekly stochastic indicator has dipped into the oversold region below the 20 index, resembling a previous accumulation period in October-November 2022. Historically, such conditions have preceded strong upward movements, making it a favorable entry point according to stochastic analysis.
Final Thoughts
In conclusion, Fantom (FTM) from Fantom Foundation is at a critical juncture, with the potential for both bullish and bearish scenarios. Investors and traders in the token should closely monitor these key levels and indicators while keeping in mind the inherent volatility of the crypto market. As always, please conduct further research and exercise caution before making any investment decisions.


