
- Bitcoin price is caught between a 50-day SMA support-turned-resistance and 200-day SMA support.
- The price of BTC is $66,919 today, a 1.0% increase in the past 24 hrs and a 4.0% decrease in the past 7 days.
- DWS Group teams up with Galaxy Digital to launch the Xtrackers Galaxy Physical Bitcoin ETC in Germany
- Morgan Stanley with $5.1 trillion in assets and UBS with $3.4 trillion, are racing to integrate Bitcoin ETFs into their platforms within the next 10 days
Bitcoin Statistics
- Bitcoin Market Cap Dominance: 50.3% ⬆️
- Bitcoin Market Cap: $1.405 trillion ⬆️
- Total Supply: 21 million
- Circulating supply: 19.673 million ⬆️
Previous Bitcoin Price Analysis
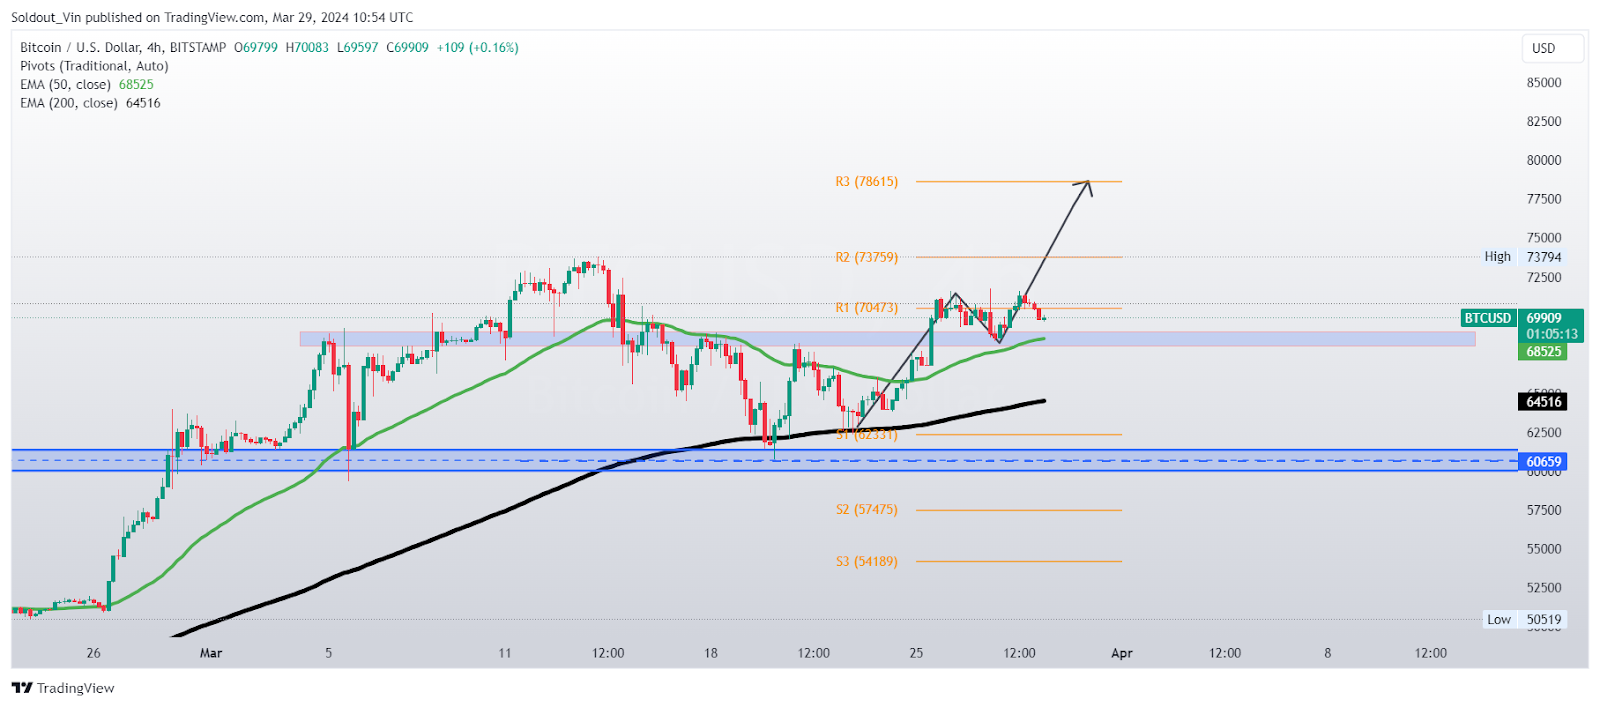
Last Week, the price of Bitcoin rose but encountered resistance around the $70,000 level. The price action formed a double-top pattern, threatening to drop to the 200-day simple moving average (SMA).
The 50-day SMA and local support at $68,000 provided rather strong support.
However, the double-tp chart pattern morphed into an extended consolidation pattern that ran for 7 days.
On April 2, 2024, Bitcoin price fell 7.77%, breaking below the range and finding support at the 200-day SMA. The price bounced off this indicator but was not able to rise much higher as the overhead support turned resistance at $68,000 proved to be a strong obstacle.
Bitcoin Decision Time: Death Cross or Bounce Back to ATH
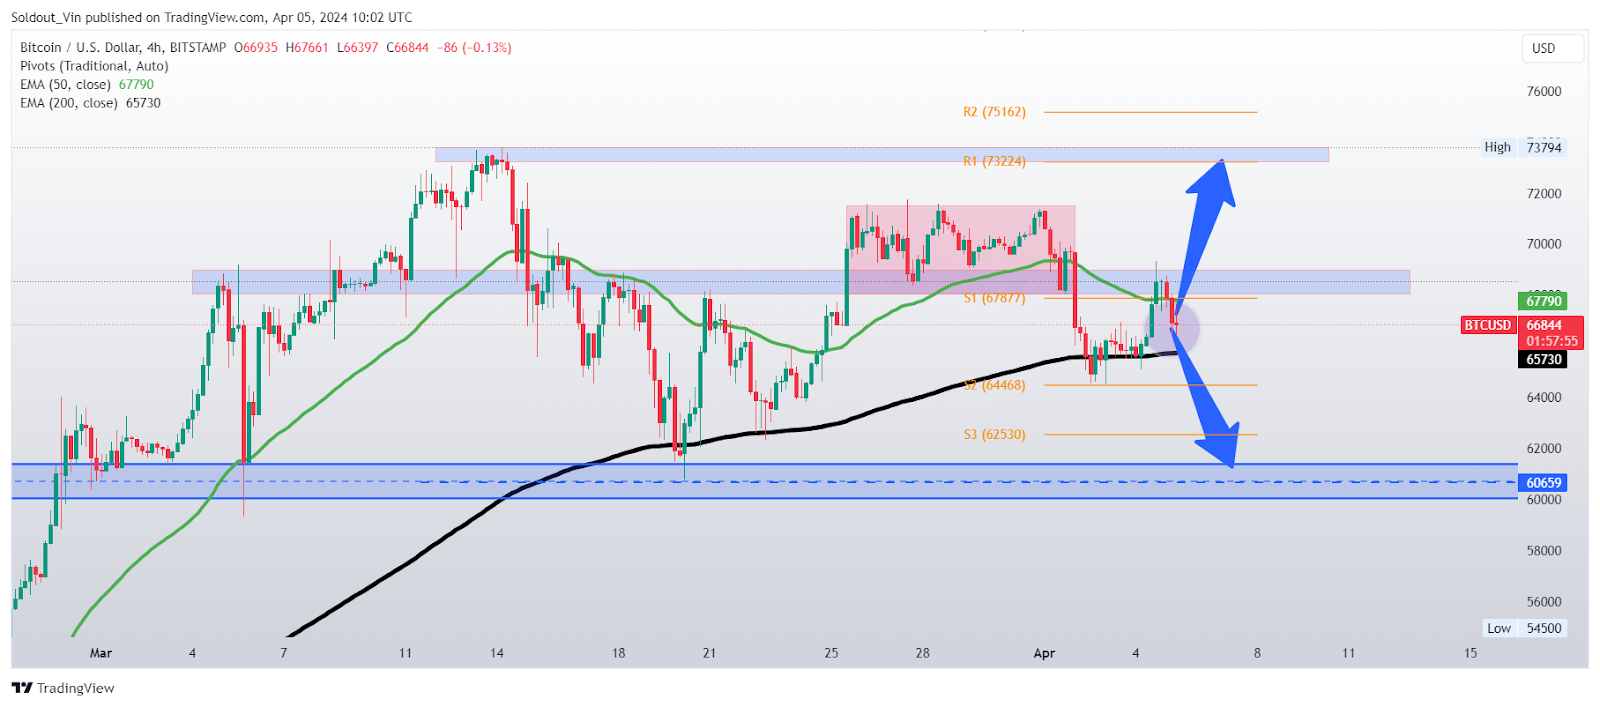
Bitcoin is caught between a fork on the road and must decide which direction to take. A break below the 200-day SMA may bring about a death cross. The death cross appears on a chart when the 50-day SMA cross is below its long-term moving average, usually the 200-day SMA. This chart pattern does not augur good news for Bitcoin.
For instance, a death cross on the S&P 500 in December of 2018 led to news headlines describing “a stock market in tatters.”
If the death cross happens, BTC could drop to as low as $60,000. However, if the 200-day SMA proves strong support, BTC could bounce back to previous all-time highs (ATH), and even establish new ATH prices.
DISCLAIMER: The work included in this article is based on current events, technical charts, company news releases, and the author’s opinions. It may contain errors, and you should not make investment decisions based solely on what you read here.


