
Bitcoin price made a run for the $28,500 resistance level earlier this week but got sharply rejected as bears emerged to have some control on the market. The price of Bitcoin now sits at 27,493.
Previous Bitcoin Price Analysis

In last week’s analysis, we saw several notable liquidity hunt zones around $25,000 and $28,000, one of which was hit this week. Price rose sharply to 28,500, obliterating the shorts and triggering the buy stops that had been set around this resistance level.
Bitcoin Statistics
- Bitcoin Market Cap Dominance: 47.8%
- Bitcoin Market Cap: $537.56 billion
- Total Supply: 21 million
- Circulating supply: 19.5 million
BTC/USDT: Bulls Trapped in a 3-Week Range

BTC’s recent surge pushed the asset toward the upper boundary of the current range. While it is unclear what may have caused the sudden spike in price, the crypto community thinks it was the launch of the Ethereum ETFs.
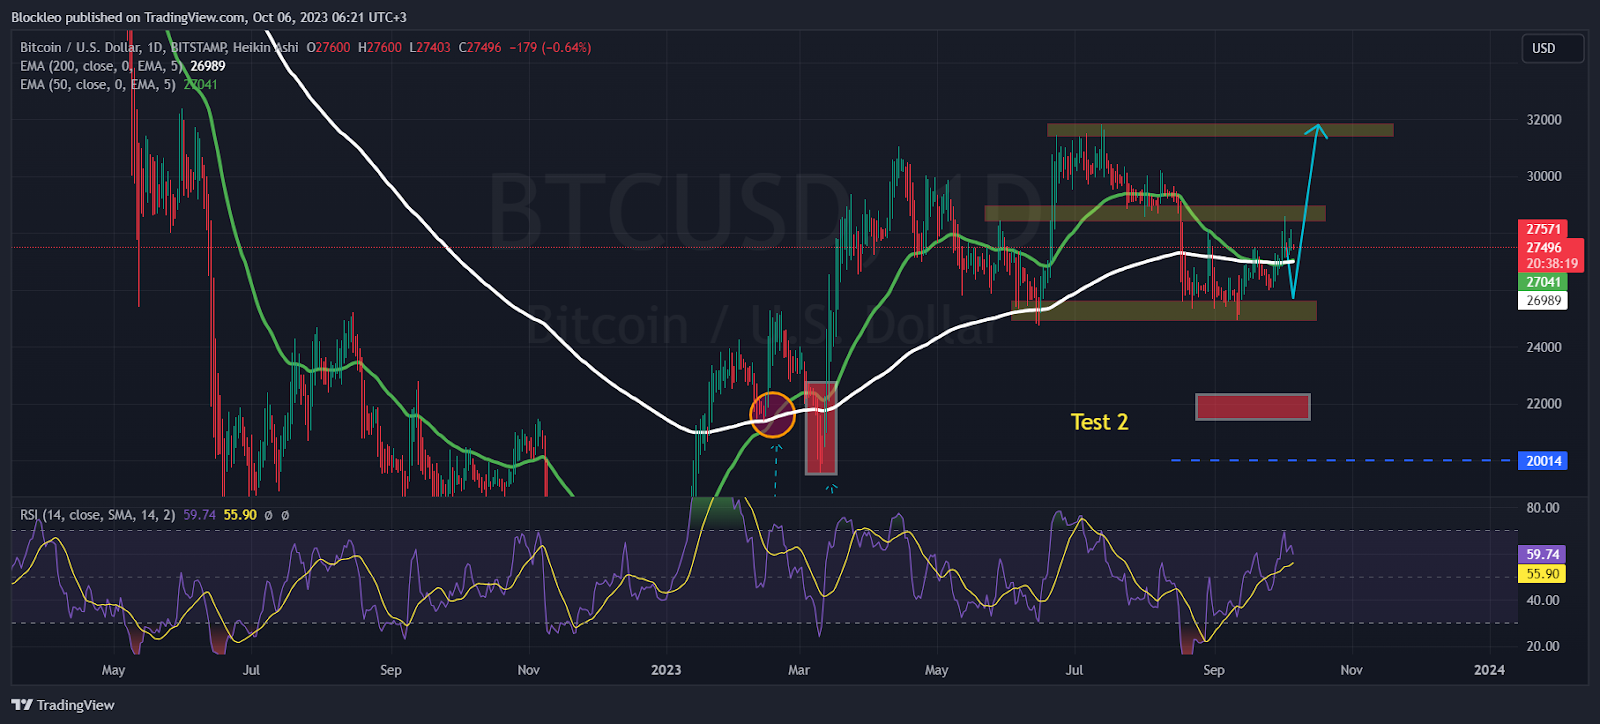
- Key Resistance Levels: $28,654, $31,570
- Key support Levels: $25,000, $21543, and $19586
- RSI: 59.71
If BTC successfully breaks out of the current range, it could achieve an average gain of 15.69%, bringing it to the second resistance level of $31,570.
On the 4-hour chart, BTC is trending above the 50 (green) and 200-day (white) moving averages. In fact, a golden cross just formed in this timeframe. This could signify a bullish October for this asset.
On the Daily timeframe, price is also trending above these EMA indicators, indicating that bulls may also have some level of control in the market.
RSI is Trending Up but Bitcoin Price is Almost Spilling into the OB Area
The Bitcoin RSI has been going up for the past couple of months since it hit a low of 14.46 on August 18. Since then RSI is up 399% and price up 11%. The RSI works in a way such that when the price enters the over-sold area, that is an indicator to enter long positions, and vice versa.
RSI is sitting at 59-level showing some room for BTC to still move upwards.
As Bitcoin price struggles to move up, trade volumes on Binance are down 48% in the month of September. The last time BTC trade volume on Binance was at this level was in April 2023.
DISCLAIMER: The work included in this article is based on current events, technical charts, company news releases, and the author’s opinions. It may contain errors, and you shouldn’t make investment decisions based solely on what you read here.


