
This article provides a comprehensive technical analysis of Algorand (ALGO), examining its daily and weekly charts, key support and resistance levels, and indicators to offer insights into the cryptocurrency’s potential future trajectory and buying opportunities.

Algorand (ALGO), like many other cryptocurrencies, has experienced significant price fluctuations in recent times. With the token also being alleged as a security by the US Securities and Exchange Commission, its price has been massively dumping forming a presumed bottom.
In this technical analysis, let us delve into the key aspects of ALGO’s daily and weekly charts, examining crucial support and resistance levels to gain insights into its potential future trajectory.
Daily Chart
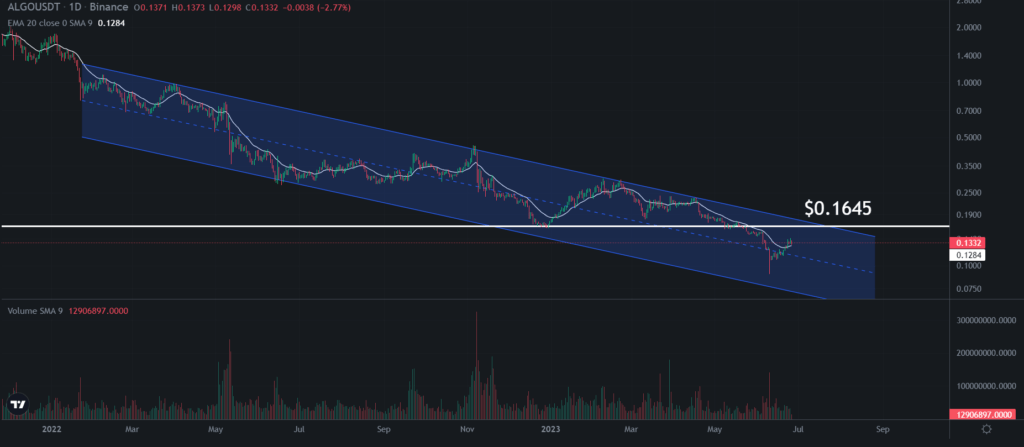
Starting with the daily chart, it is evident that ALGO is currently following a channel down pattern. Until a breakout from this pattern occurs, the cryptocurrency is expected to adhere to the channel’s support and resistance levels. The recent bounce off the support level on June 10th indicates a potential retest of the resistance level in the near future. However, it is crucial to note that a significant breakout is unlikely until Bitcoin starts gaining momentum above the $33,000 to $34,000 range, as ALGO’s performance is closely linked to Bitcoin’s movements.
Examining the volume indicator is essential to confirm the validity of any potential breakout. If a breakout occurs without significant volume, there is a higher likelihood of a retracement back into the channel. Additionally, it is worth mentioning that ALGO broke below a significant support level at $0.1645 in May 2023, and a retest of this level as resistance could happen in the future.
Daily RSI

Analyzing the daily RSI, we observe that ALGO reached an incredibly low index of 15, presenting a remarkable buying opportunity. Breaking above the support block, which was previously a resistance, is a positive sign. Ideally, after a retracement to the upside concludes, a retest of this block as support would provide a solid foundation for a potential second leg up.
Weekly Chart

Moving to the weekly chart, we find a support block ranging from $0.167 to $0.111. ALGO perfectly retested this level, suggesting its significance. Despite the current bearish outlook, there is a possibility of a midterm retest of around $0.17, which coincides with the 20EMA on the weekly chart. Breaking above the descending resistance trend line, in place since November 2021, would be the first major bullish signal and increase the chances of a trend reversal. Confirmation from the volume indicator is crucial for further validation.
Weekly RSI

The weekly RSI dropped below the support block but managed to climb back up to this level. This indicates a notable pullback for ALGO, highlighting the importance of the support block.
Weekly Stochastic

Looking at the weekly Stochastic indicator, we observe that ALGO reached oversold territory, presenting a perfect buying opportunity. This aligns with a previous buying opportunity in December 2022.
Final Thoughts
In conclusion, ALGO has faced challenges within its technical analysis. While a breakout from the channel and a reversal of the overall trend are yet to occur, there are signs of potential upside movements. Monitoring Bitcoin’s performance, volume indicators, and confirmation from key resistance and support levels will be crucial for determining the likelihood of the token’s future price action. As always, it is important to conduct thorough research and exercise caution before making any investment decisions.


