
Bitcoin, the world’s largest cryptocurrency, has recently flashed a golden cross on its price chart, a technical indicator that has sparked hopes among investors and traders of a super bull run.
The ‘golden cross’ is a common technical analysis term for bullish chart patterns. It occurs when a short-term moving average, typically the 50-day moving average, crosses above a long-term moving average, typically the 200-day moving average, on a price chart.
Previous Analysis
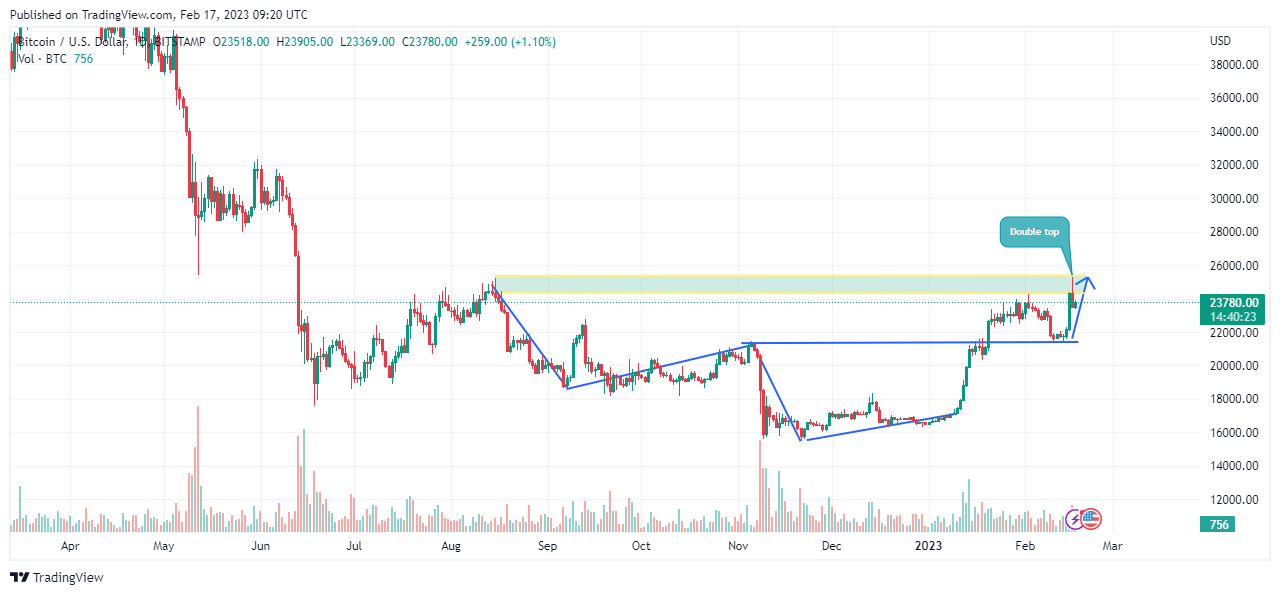
Last week, Bitcoin attempted to break the $25,000 resistance level but faced selling pressure, causing its value to drop. However, positive momentum came back as buyers returned to the $25,000 level.
BTC’s price needed to surpass the $25,000 barrier to continue its upward trend toward the $30,000 range, which is a psychological price point. At the time of writing, Bitcoin was trading at $23,758.00. The double top pattern indicated a possible further bearish move towards the $22,000 support.
Bitcoin Next Week
BTC/USD Chart by Tradingview
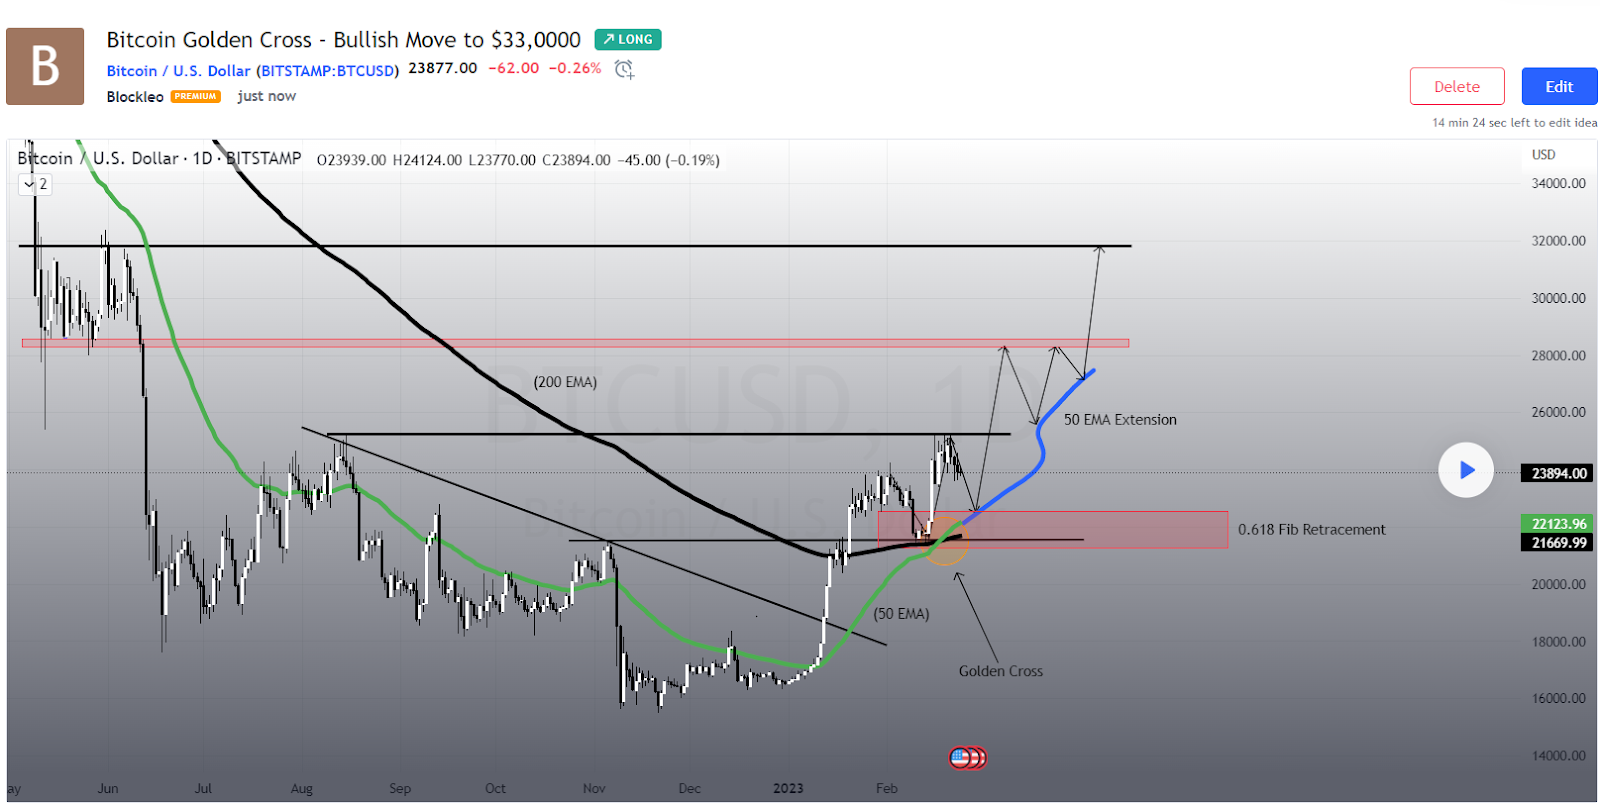
The 50-day moving average just crossed above the 200-day moving average, a popular bullish signal in the crypto and financial trading world. Bitcoin dropped back to the $22k area (zone of the cross) and found pretty healthy support, from which it bounced back up strongly and made for the $25k mark.
$25k proved a stronger resistance than the bulls previously, though. Now letting out some steam, the bulls (or, shall I say, ‘the manipulators’) are gearing up for another try at the 25k resistance.
Remember that this is a long forecast on BTC, but it is short-term. A sharp spike upwards to $33k, then a flash crash to less than $0.1 and back up to $10k is expected soon (purely off the charts). Fundamentals aside, the strong support provided by the 50-day EMA will give Bitcoin bulls the extra juice they need to break up over $25k.


