The analysis focuses on the token’s daily and 3-day charts, key resistances, and bullish indicators, providing insights into its potential for growth in the coming weeks and months.
VeChain (VET) is a blockchain-based platform designed for supply chain management and enterprise solutions.
Since the beginning of 2021, its native token has been on a downward trend, and it is currently consolidating after reaching a low point. The current bullishness of the cryptocurrency market, on the other hand, makes the present a good moment to investigate VET’s technical analysis in order to evaluate the scope of its potential for expansion in the weeks and months ahead.
Daily Chart
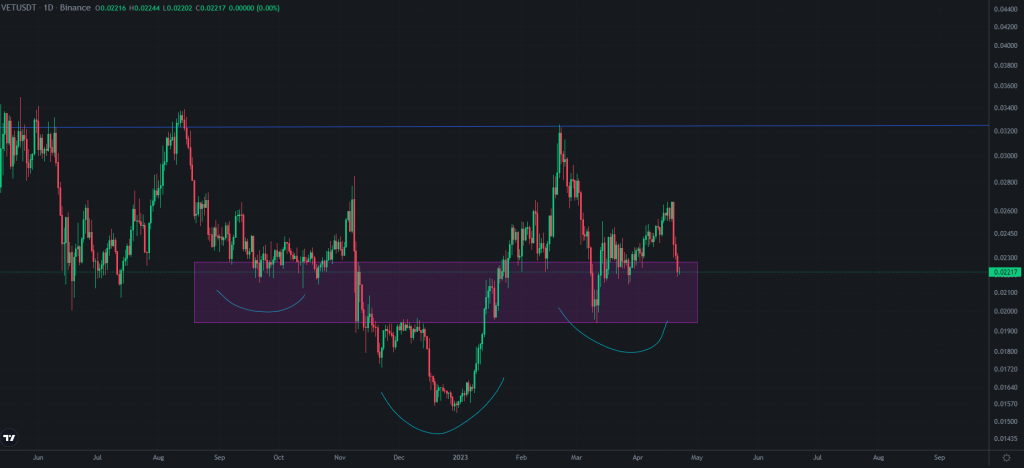
When we take a look at the daily chart for VET, we can see that the asset is now creating an inverse head and shoulders pattern. In technical analysis, this particular pattern is interpreted as a bullish signal, suggesting that there is a possibility that a downward trend will transition into an upward trend. In addition to that, we just completed a thorough backtest of the support block, which indicates that the support level is holding strong.
Before, VET started dumping on March 9th, this was a great entry point at around $0.02. This was a nice buying opportunity because we had a similar bounce here in June of last year as we broke down below in December, and then we had a massive impulsive move to the upside and a backtest of support. We have now back tested this support block, and it looks like we are starting to move to the upside.
Daily RSI
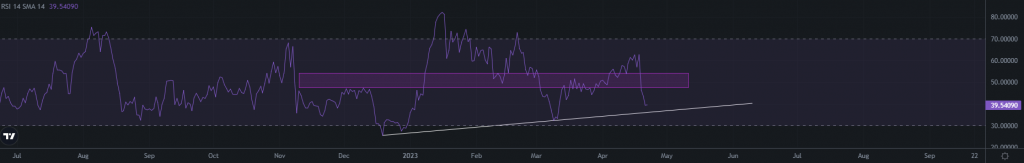
Jumping into the daily RSI, one thing to look at is the white ascending trend line, which we have been backtesting as support for a couple of weeks. We had a backtest in December, and we also had a backtest all the way back in March this year. Currently, we are below the resistance block, and it looks like it is testing the support trendline once again.
3-Day chart
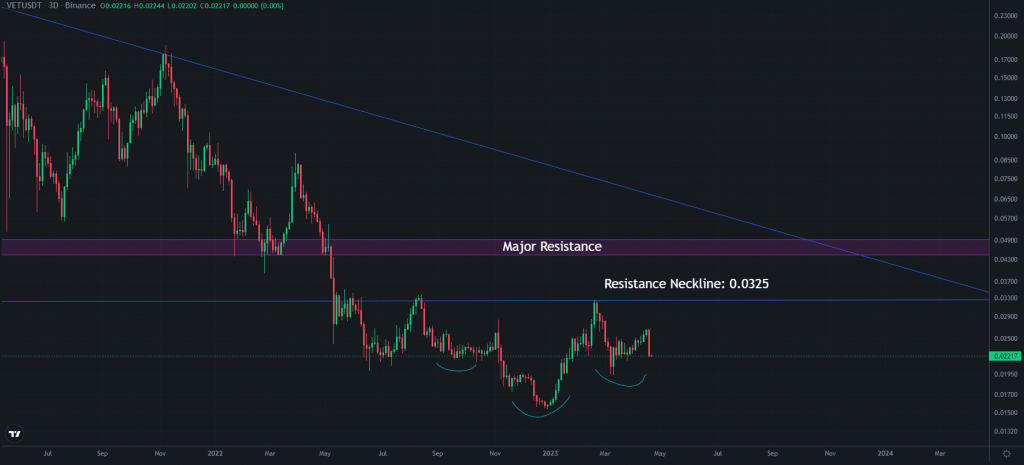
We also see a massive inverse head and shoulders pattern on the 3-day chart. This reinforces the bullish sentiment we observed on the daily chart.
Key resistances to break
In order to maintain our positive stance, we need to break over the high that we reached on the 20th of February and continue this uptrend. If VET keeps printing lower highs, then it is likely going to get jammed up between the support block and the resistance trend line, and if Bitcoin decides to pull back, we will probably see a dump as a result. On the other hand, if you plan to keep the investment for a significant amount of time, you do not need to be concerned about this.
Final Thoughts
Overall, the technical analysis of VeChain suggests that the token is in a bullish phase. With the formation of the inverse head and shoulders pattern on both the daily and 3-day charts, and with support levels holding strong, we could see continued growth in the coming weeks and months. However, as with any investment, it is essential to do your research and consider all factors before making any decisions.


