
This article will present a technical analysis of the NEAR Protocol (NEAR) based on its daily chart, relative strength index (RSI), and the weekly chart in order to interpret the token’s movements in the near term.
NEAR Protocol is an open-source, decentralized blockchain platform designed to facilitate the development and deployment of applications that require scalability, low fees, and high throughput. The platform is built on a sharded architecture, which means that it divides its data and processing power into multiple shards, allowing it to process multiple transactions at the same time.
In this article, we are going to take a more in-depth look at the technical analysis of NEAR Protocol, and we are also going to share some thoughts on the token’s next move.
Daily Chart
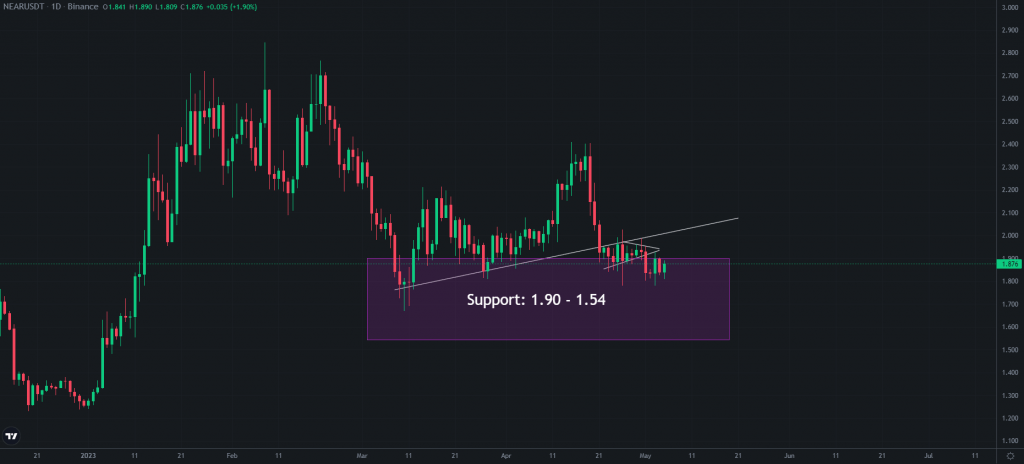
Taking a look at the daily chart, you can see that we are making our way back down, which is something that we have been doing for the past few days. We broke through the trend line that was acting as support, and after that, it back tested the trendline as resistance before continuing to fall.
Fortunately we are still holding the top of the support block which is around 1.90 which is a major support level. But as you can see we are getting squeezed up in between a support level and a resistance level down below forming some sort of a symmetrical triangle.
As long as we stay in this support block, we are good for continuation as long as we do not drop below 1.54. If that does happen, then it will probably mean that it is going to take a bit longer for us to recover.
RSI – Daily
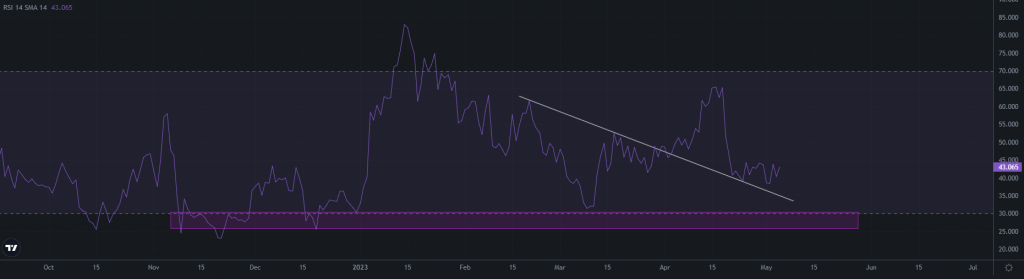
Taking a look at the daily RSI, if we look at this support, this was perfectly retested. The RSI broke above the resistance and came back down to retest it as support. If we end up coming back down one more time, then the trend line will be an amazing entry.
We also have the support blocks that are based off of the local low that printed in June of 2021 and the local low that printed in February of 2022. So that is sort of the average area you want to be looking at for a very good buying opportunity.
You can see that there are times when the RSI drops below 25, indicating a drop below the support level. There will be a retracement to that level in the near future, and it will be an even better entry point.
Weekly Chart
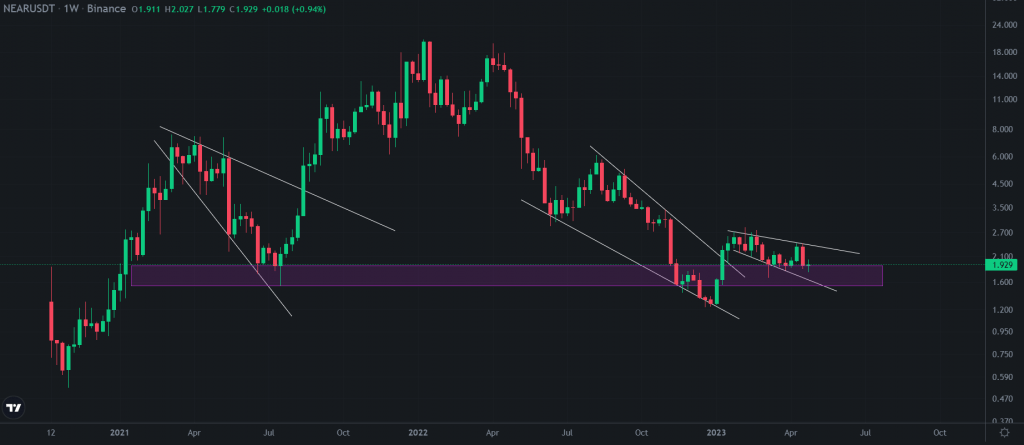
Right now we are in a descending broadening wedge. The chart is currently in a pattern quite similar in 2021; however, it was far larger than the pattern we are in now. Another similarity is that we ended up coming back down in this descending broadening wedge and then we bounced off the support block.
Final Thoughts
Overall, the technical analysis of NEAR Protocol looks promising. If we are able to break out of the current wedge pattern, then it is possible that we will be headed back up, albeit probably not to all-time highs. In the meantime, we want to maintain a close check on the primary levels of support and resistance and search for the most advantageous entry and exit locations.


