
This article will provide a technical analysis perspective of Elrond (EGLD), examining its price dynamics and pivot points in order to help traders and investors make informed investment and trading decisions.
MultiversX, previously known as Elrond, is a blockchain-based platform that aims to provide a highly scalable and efficient infrastructure for decentralized applications (dApps) and enterprise use cases. It utilizes a unique architecture called Adaptive State Sharding, which enables high throughput and fast transaction processing. This sharding mechanism divides the network into smaller shards, allowing for parallel processing of transactions and smart contracts.
In this article, we will be delving into the charts to look for potential price entries.
Daily Chart
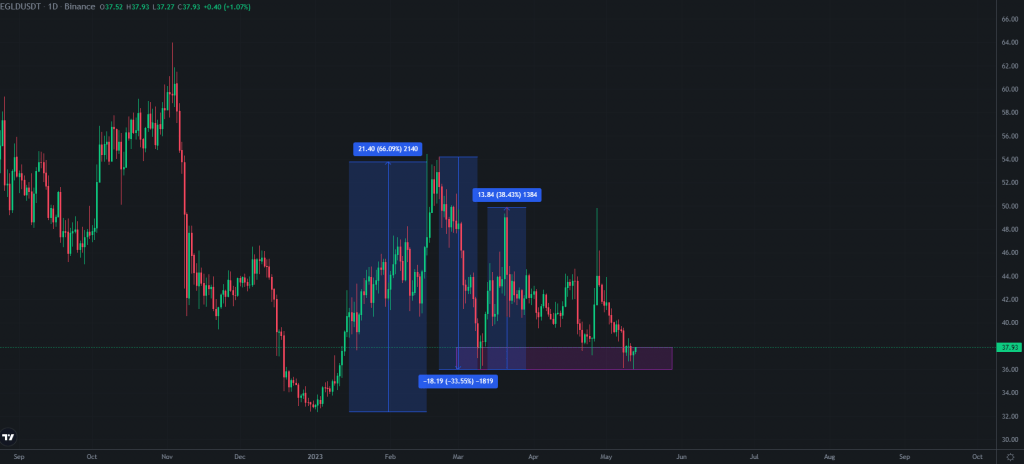
Taking a closer look at the daily chart, we observe a significant run-up of 66% from the December low. This notable increase is particularly impressive, considering the prevailing bear market conditions. However, following this surge, EGLD experienced a subsequent 33% drop before rallying once again, resulting in a 36% gain. Since then, the price has been on a downward slope, albeit with a notable upside wick.
The support level around $35-37 emerges as a crucial area to monitor. If this level is breached, there is a possibility of a decline towards $32-33, which represents a local low or a bear market low. However, if a retest of the $33 support occurs, it may present an excellent buying opportunity for traders.
Daily RSI
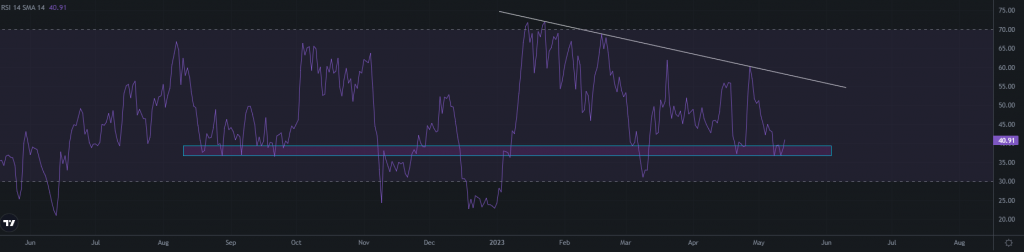
Examining the daily Relative Strength Index (RSI), we can identify a descending resistance trendline. Notably, the support block between 35 and 30 has proven to be a reliable area for purchasing EGLD, whether for swing trades or long-term investments. A break below this support level may result in a decline towards the next target at approximately 25.
Weekly Chart
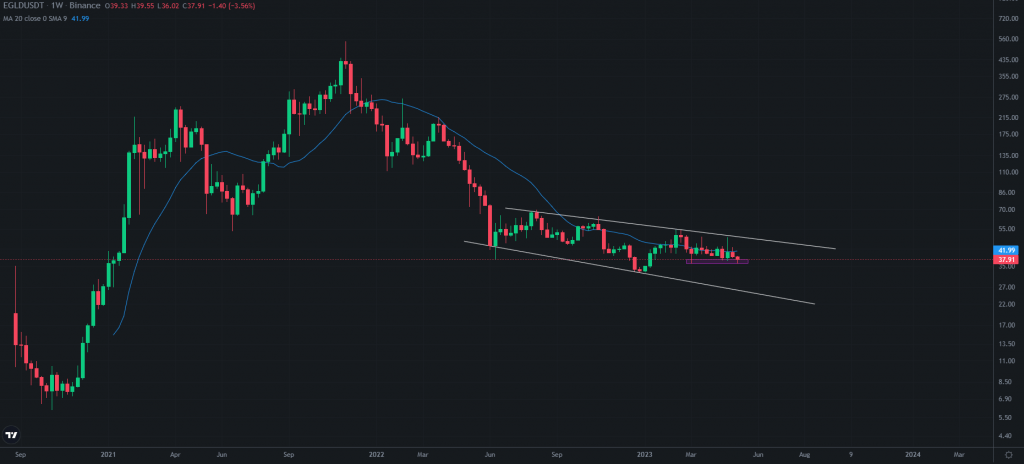
Shifting our focus to the weekly chart, we find EGLD within a descending broadening wedge pattern. Typically, when this pattern forms near the bottom of a chart, it often precedes a breakout. Additionally, there is a descending resistance trendline that EGLD has been testing and failing to break since August 2022. This indicates the possibility of encountering further resistance and potential retracement towards the support level, potentially dipping below $30.
To establish a more bullish sentiment, it is essential for EGLD to surpass the 20-week Moving Average (MA) and overcome the aforementioned resistance trendline. Such a breakout would serve as a robust indicator for a potential upward move to higher price levels.
Weekly Volume
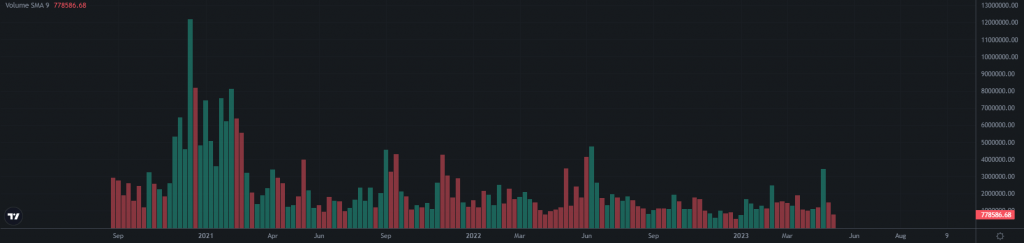
One aspect of concern is the relatively low volume observed in EGLD’s weekly trading. For a significant price breakout, it is crucial to see a substantial increase in trading volume as it signals greater market participation and conviction among investors.
Final Thoughts
In conclusion, the technical analysis of Elrond (EGLD) reveals several key factors to consider when assessing potential trading and investing opportunities. However, it is crucial to remember that no analysis or indicator can guarantee future price movements. Traders should exercise caution, conduct thorough research, and utilize proper risk management strategies when making trading decisions.


