
Bitcoin has performed poorly since our last analysis. Over the past 7 days, the market has seen several developments, none of which has positively affected the King of Crypto. Bitcoin’s price is $19,883 as of the time of writing.
Here is what Bitcoin is likely to do this coming week.
Previous Analysis
Last week, July 7, Bitcoin was trading at around $21,300 after pasting one nice green candle the day before. However, it was a bull trap, and traders who rushed to long Bitcoin lost a lot of funds if not all.
The previous bullish scenario for Bitcoin predicted the asset might rise to $24,724 after breaking out of an ascending triangle. So let’s first examine what happened to this scenario.
The Ascending Triangle
As of July 8, BTC was moving up and out of the ascending triangle signifying that bulls were winning. This scenario was predicted to result in a +20% increase to around $25,900. But as you can see from the chart, the 21-day moving average proved tough.
Bears regained control and pushed the price down to lows of $18,905.
Double Bottom
The other bullish scenario was the double bottom pattern which would have been even more lucrative for bulls. It would have resulted in a +48% increase to $31,549. Because of the recent bear move, the double bottom pattern was invalidated and is, as of now, no longer in play.
Next Week on Bitcoin Price
The bearish pattern we explored last week is still in play. Actually, there are two bearish scenarios.
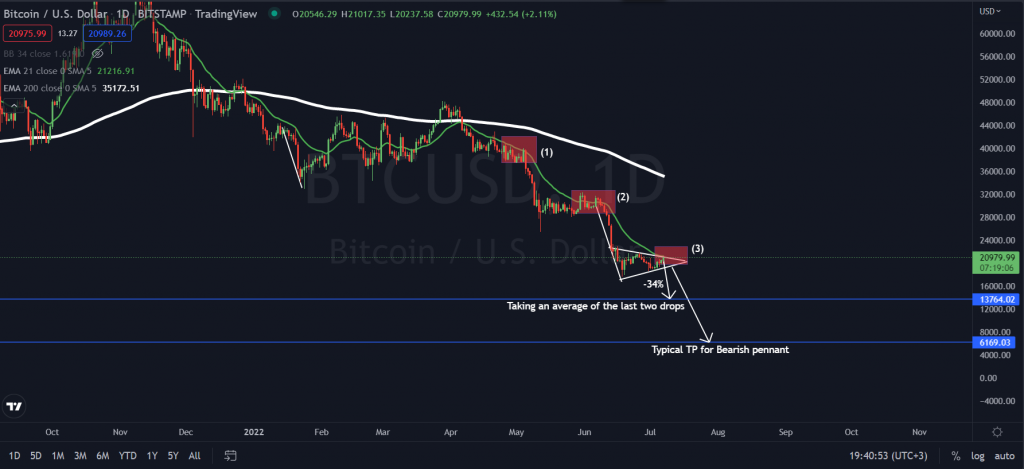
21-Day EMA Price Suppression
BTC price has been trending below the 21-day EMA for over 3 months. It has tried to break above this resistance indicator three times. The third time was last week, on July 8. After this rejection, we expected an average of -34% drop to around $13,764. This has not happened yet, but the prediction is still valid.
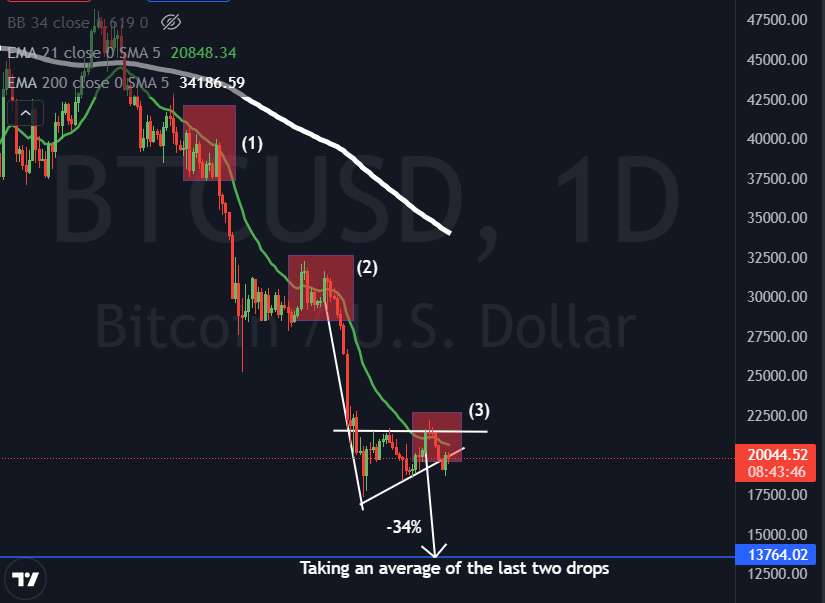
Bulls have tried to hold the line, but sooner or later, they will grow tired.
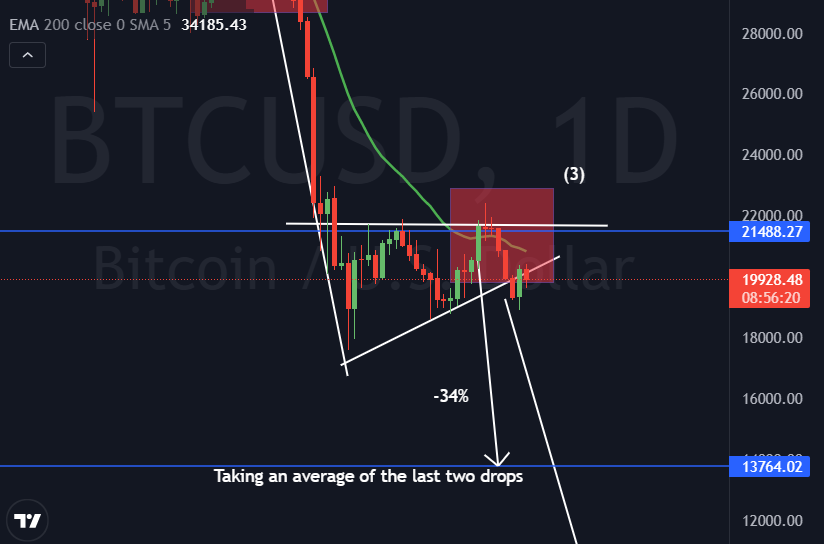
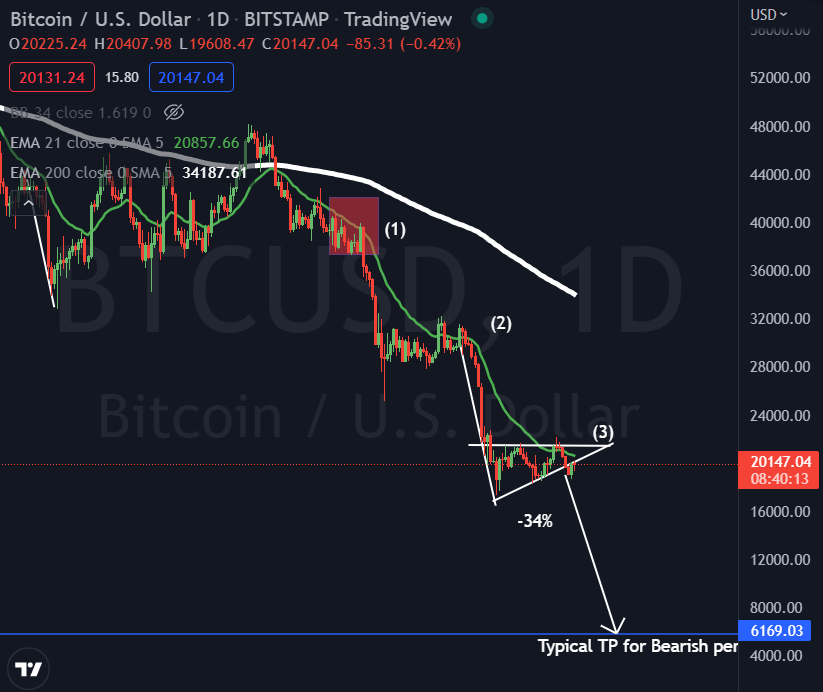
Bearish Pennant
The bearish pennant strengthens the case for a bearish Bitcoin. On July 12, the price closed below the bottom trendline of the pennant, signifying more bearish power. The classic chart pattern for breakouts includes a retest before the price continues in the breakout direction.
It would seem BTC is retesting the bottom trendline of the pennant before moving downwards. If this is the case, the typical take-profit region (for leverage traders – shorters) would be around $6,169.
There is a possibility that this could be a fake-out but the chances are extremely low. Brace for double-digit losses.


