
It was a week full of uncertainty for both crypto and traditional markets as the Federal Open Market Committee (FOMC) prepared to announce the new interest rates earlier this week. In addition, the National Bureau of Economic Research (NBER) was also set to announce Q2 data on the national GDP.
Both reports came out less than satisfactory, but did BTC flinch? Let’s find out in this week’s analysis of Bitcoin price.
Previous Analysis
Last week Bitcoin showed signs of trending up after it broke out of this downtrend. However, the typical retest had not happened yet, and it was what we were waiting for this week. If the retest was going to be affected by these two pieces of news, then BTC would tumble down to the $13k mark.
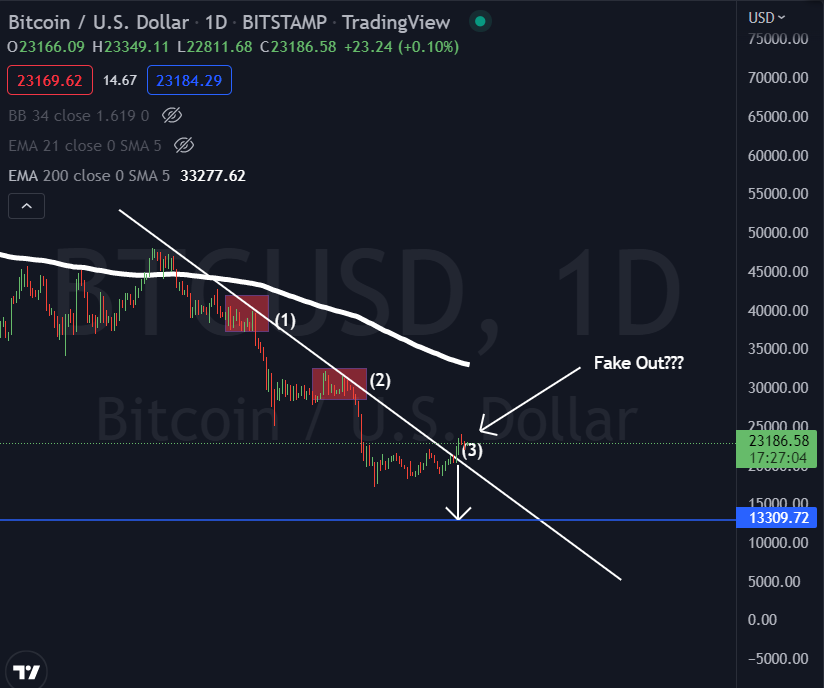
The bullish scenario for BTC last week would have it touch $25,745. However, Bitcoin has somewhat been consolidating between a local low of $21k and a local high of $24k.
Where is BTC Headed?
The Federal Reserve on Wednesday raised the interest rates for the second time in a row by 75 basis points (or 0.75 percentage points), bringing the benchmark rate to a range of 2.25% to 2.5%.
On Thursday, the National Bureau of Economic Research released its Q2 GDP data, which revealed that the United States economy had contracted two quarters in a row. In Q1, the GDP fell by -1.6%, and in Q2, it fell by a further -0.9%.
Bearish Scenario
Bitcoin’s bearish case is weak, at least for now. After last week’s mini-pump that sent the asset to about $25k, the price action cooled off but still remained above the 21-day EMA (Green line). BTC used this moving average as its local support and bounced off it.
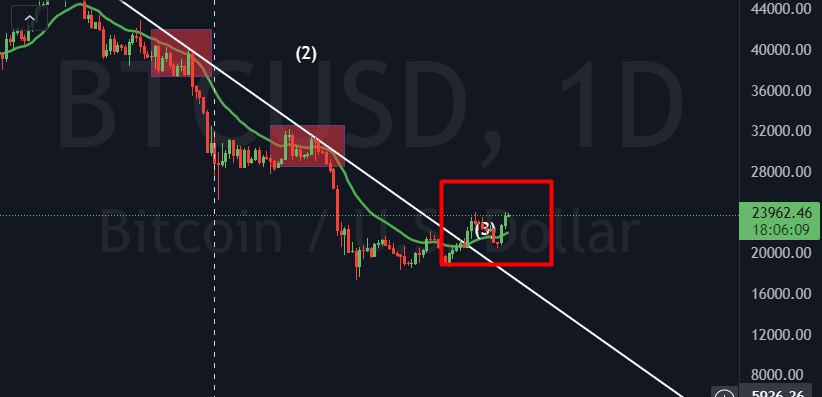
While this is good, many have called this Bitcoin run a bull trap. The current forming pattern might quickly evolve into a double top and send Bitcoin crashing all the way to $18,165.
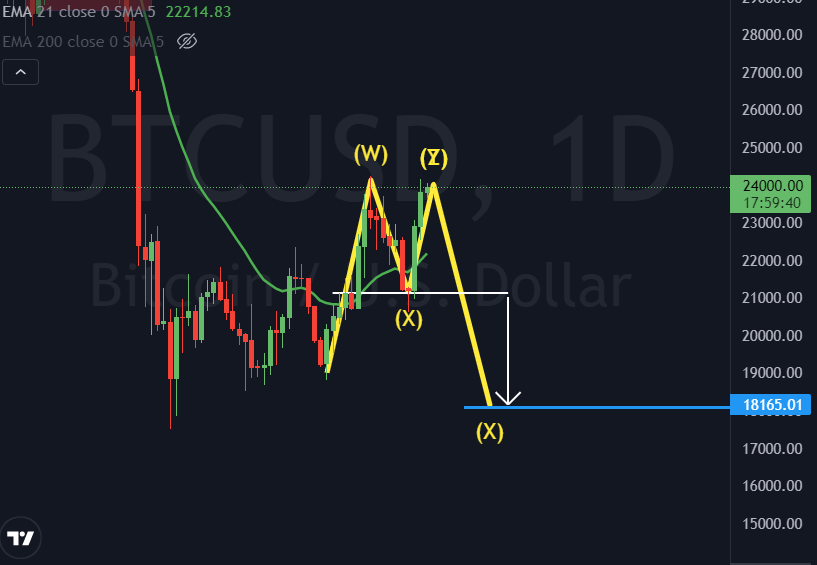
From $18,165, it is a free fall to $12,060. While this bearish scenario is far-fetched, it could still happen. So best be alert.
Bullish Scenario
Twitter is flush with calls of “bull season is back.” All the signs (or at least most of them) indicate that the market is turning from red to green. BTC is trending above the 21-day moving average for the first time in about 3 months.
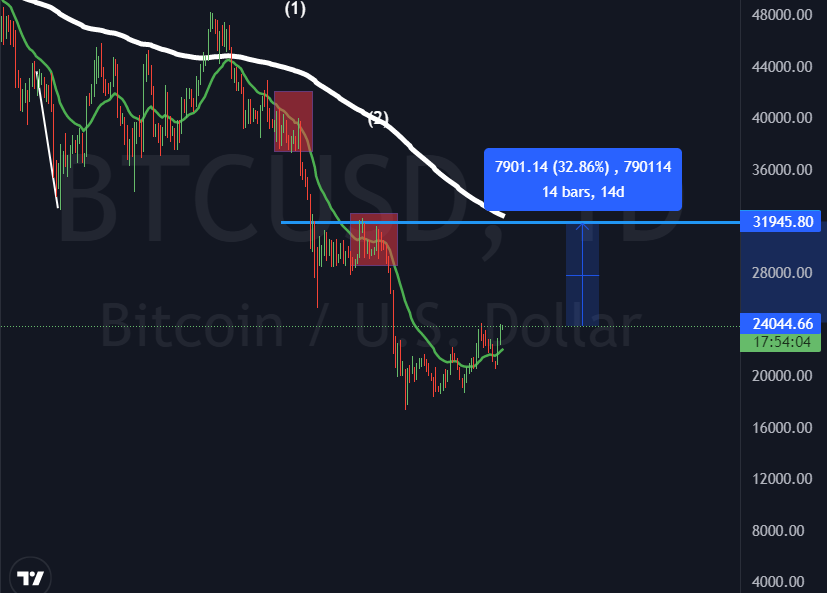
If Bitcoin bulls manage to take control of the market, BTC is looking at a +32% run up to $31,945, where it meets the 200-day EMA. This has been known to be a strong resistance/support indicator, and if BTC breaks above it, we will witness prices above the $40k mark.
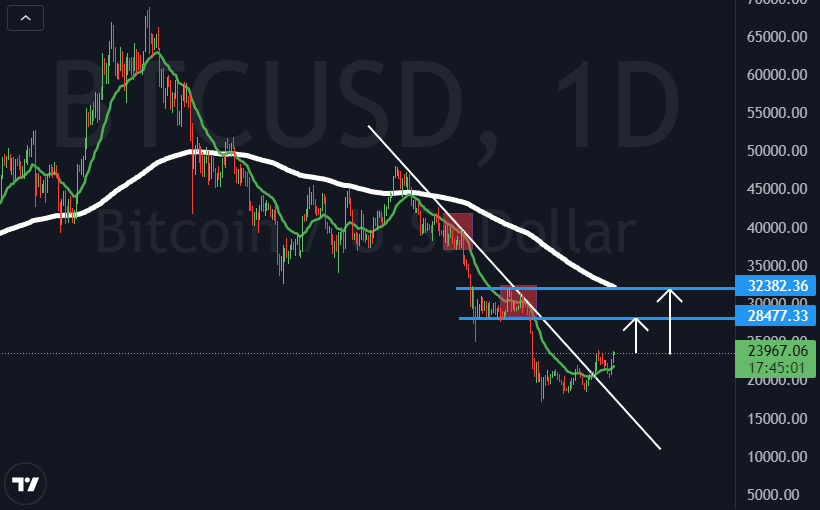
The two most likely short-term bullish targets for Bitcoin are $28,477 and $32k.


