
This article will conduct a technical analysis of BNB to assess its price stability, examine patterns on various charts, and provide insights on potential buying opportunities and support levels for investors.
Over the past year, Binance, one of the leading cryptocurrency exchanges, has faced its fair share of challenges, including widespread fear, uncertainty, and doubt (FUD). Despite these obstacles, BNB, Binance’s native token, has demonstrated remarkable resilience, maintaining a relatively stable price compared to other cryptocurrencies.
In this article, we will delve into a technical analysis of BNB to determine whether it can sustain its current price in the coming weeks, while also highlighting key support levels for investors to consider.
Daily Chart
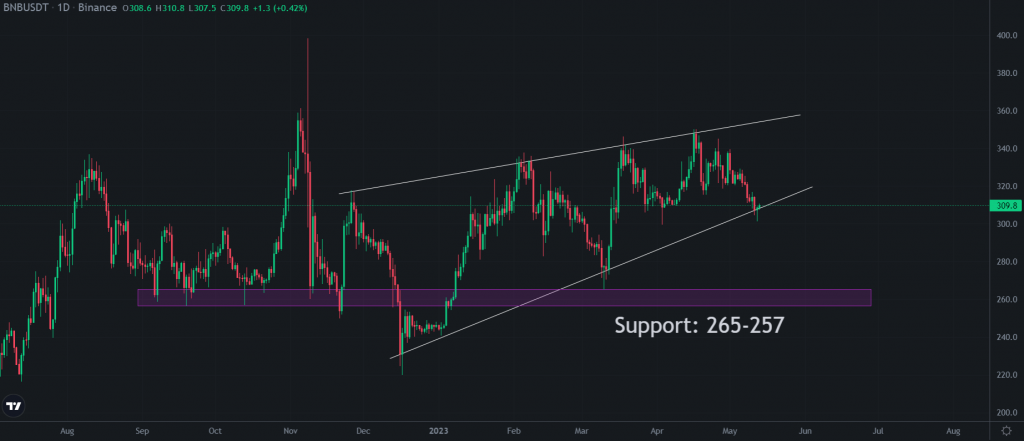
Analyzing the daily chart, we observe that BNB is forming a rising wedge pattern, which typically signifies an impending downside break. If the trend indeed breaks downward, we could witness a support level forming around the range of $265 to $257. This potential dip presents an excellent opportunity for investors to employ a dollar-cost averaging strategy and accumulate BNB. The identified support block is based on the September 2022 wick low, adding further significance to its importance.
Daily 100 and 200 Moving Averages (MA)
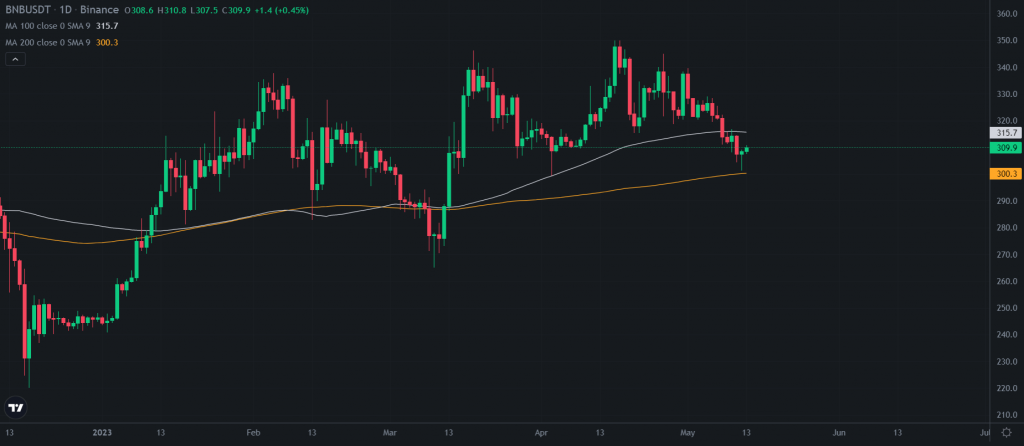
When considering the daily 100 and 200 MA, we notice that the price of BNB is currently above the 200 MA, which is acting as a support level. However, the 100 MA is serving as resistance. This suggests that BNB is likely to trade within the range of $300 to $315, bouncing between these levels until it reaches a decision point, breaking either to the upside or downside. Traders should closely monitor this range as it may provide valuable insights into the future direction of BNB’s price.
3-Day Chart
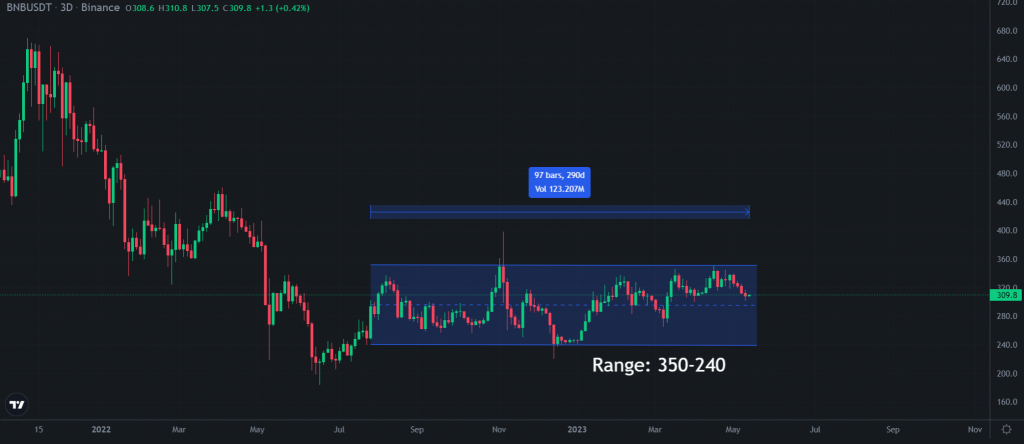
Zooming out to the 3-day chart, we can observe that BNB has been consolidating between the price range of $350 and $240 since the second half of 2022.
This prolonged consolidation phase aligns with Wyckoff’s method and suggests that BNB may be in an accumulation stage.
Accumulation often precedes a significant price move, indicating that BNB might be preparing for a potential breakout in the future.
Weekly Parabolic SAR
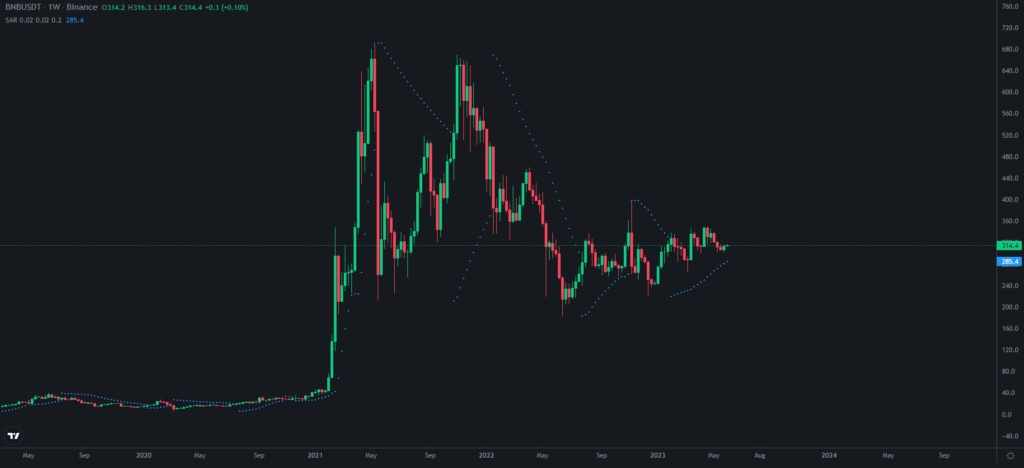
Turning our attention to the weekly Parabolic SAR indicator, BNB has been on an uptrend since January 30th. This positive trend signifies that BNB has been consistently making higher highs and higher lows, suggesting a bullish sentiment in the market. The weekly Parabolic SAR indicator reinforces the notion that BNB has the potential to maintain its current price or even experience further upward movement.
Final Thoughts
As we analyze the technical aspects of Binance Coin (BNB), it becomes evident that despite the prevailing market uncertainties, BNB has displayed resilience and stability. With a potential downward breakout in the short term, investors may find advantageous entry points, particularly within the $265 – $257 support range. However, it is crucial to monitor key indicators such as moving averages and consolidation patterns to gauge BNB’s future trajectory accurately. Considering these factors, investors can make informed decisions while navigating the ever-evolving cryptocurrency market.


